This page summarises our most recent research into liquidity conditions in the UK corporate bond market.
Using not only standard measures of liquidity but also measures of dealers’ ease of trading, we find there has been a decline in liquidity from mid-2014 onward. However, from a long-term perspective this reduction in liquidity appears moderate.
Previous research conducted by the our Chief Economist’s Department for the period 2008-2014, as well as reports by FINRA1, the AMF2 and IOSCO3 covering similar time periods, found little evidence of a quantifiable deterioration in liquidity.
In this note, we update our study by extending our analysis to include the period after 2014, as well as incorporating new data about orders and quotes. Our findings suggest there has been a moderate decline in transaction-based proxies for liquidity from mid-2014 onward.
We also find that from mid-2014 there has been – at least for some firms – an increase in the amount of failed or rejected trades, an increase in the amount of time it takes to fill an order, a decline in dealer quote rates on electronic bond trading platforms, and a slight widening of some quoted and effective bid-ask spreads.
Taken together, this indicates that trading conditions have become somewhat more difficult over the past 18-24 months. Market participants may have to work harder today to complete a trade than in previous years.
Updated liquidity metrics
Using a variety of different proxies for liquidity, our previous research found little evidence of a quantifiable deterioration of liquidity for the period 2008-2014. We extended the time period covered by these liquidity measures to include the period up to end of June 2016 and find that liquidity deteriorated in 2015-2016, as shown by the increase in the metrics in Figure 1.
Liquidity also appears to have become more volatile, demonstrated by the increase in the standard deviations of the liquidity measures shown in Figure 1.
Figure 1: FCA liquidity measures
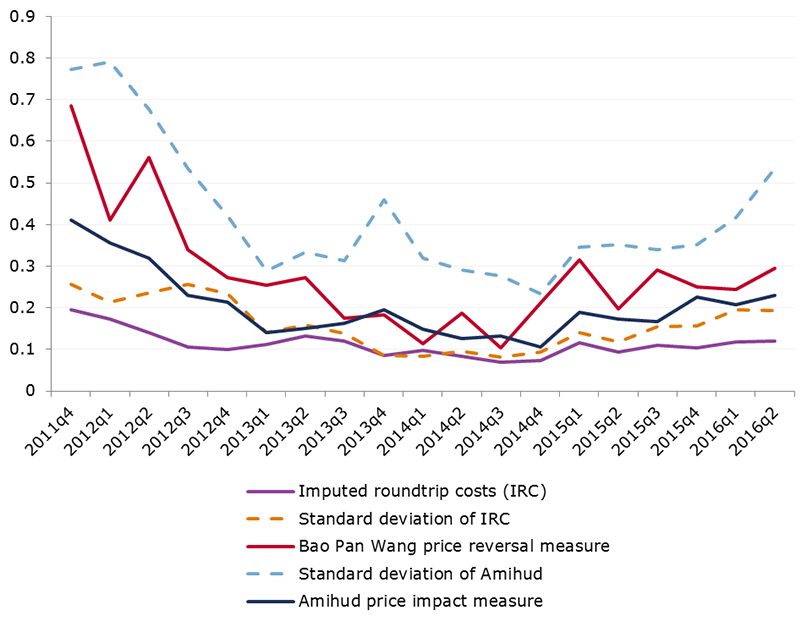
Source: ZEN transaction reporting data, FCA calculations. Note: an increase represents a decline in liquidity.
Different proxies for the cost of liquidity examined include:
- Imputed round-trip costs (which measure realised bid-ask spreads).
- The Bao, Pan, Wang measure estimating the magnitude of price reversals (i.e. the negative of the autocovariance of subsequent bond returns).
- The Amihud index, which measures the average impact of trades on market prices.
Quoted bid-ask prices can be an unreliable proxy for liquidity where dealers are not obligated to trade at the prices they quote on screen. Another drawback is that the prices are usually quoted for small or standard trade sizes.
Nevertheless, the quoted bid-ask spread is a metric commonly used in attempts to measure liquidity. Figure 2 shows how quoted4 bid-ask spreads in a sample of British and European corporate bonds traded on MarketAxess narrowed in the years prior to mid-2014 but have since widened slightly. However, similar to the transaction-based measures they are still quite low from a historical perspective.
Figure 2: Bid-ask spreads
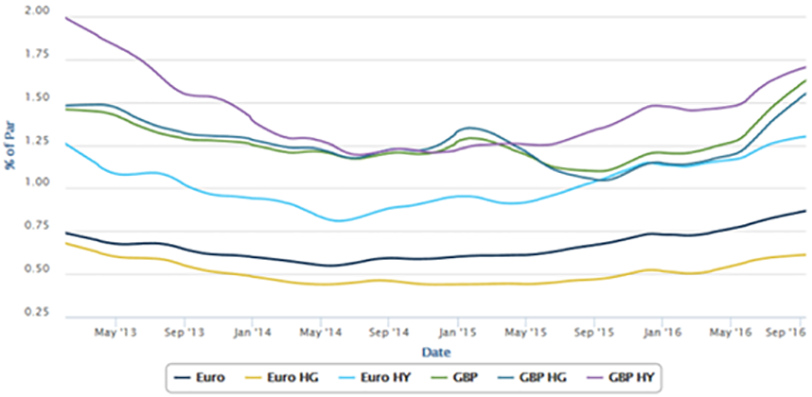
Source: MarketAxess
Orders that could not be filled
One criticism of transaction-based liquidity measures is that they disregard transactions that did not take place.
We have consequently analysed data provided by one market participant encompassing both its attempts to trade as well as executed trades from late 2007 to mid-2016. The firm is a specialist fixed-income trading house involved in roughly US$10bn-15bn of corporate bond transactions per year. In total, we received information on approximately 830,000 orders (i.e. attempted execution with a chosen counterparty at a specific quantity and price) and requests for quotes (i.e. request for quotations (RFQs) – where the firm asks one or more dealers to provide a price for a particular bond). The data also includes bilterally arranged over-the-counter (OTC) transactions later executed through Bloomberg5.
Figure 3 shows how the percentage of the firm’s orders and RFQs that result in a trade has declined materially over the sample period: from around 65% before the financial crisis, to around 30-35% in 2013-2014 and as low as 20-25% today. This is mostly attributable to a significant increase in the proportion of orders and RFQs that dealers reject or do not respond to. The trend is very similar when analysed by either face value or number of attempts to trade.
Figure 3: Outcomes of orders and RFQs in percentage of number of attempts to trade
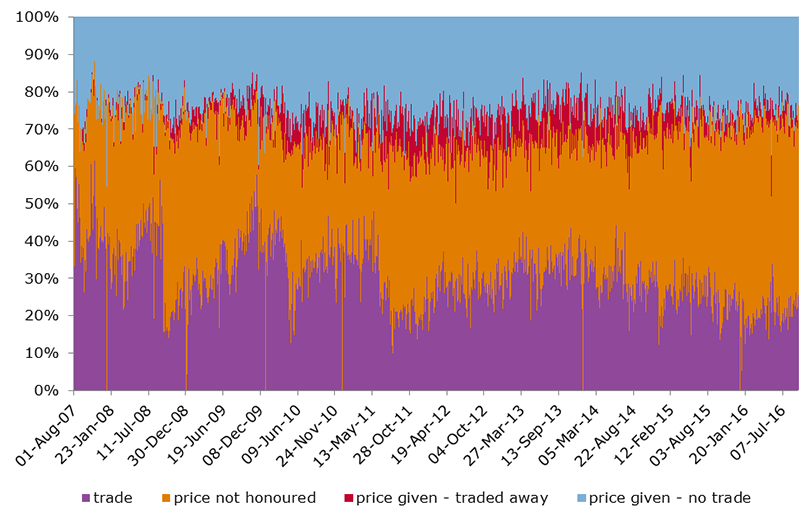
Source: Trade records from an anonymous firm
We also looked at the number of orders or RFQs sent before a trade is executed, as well as the time it takes until a trade gets executed. In 2007, the average number of requests sent before execution was close to one (with a maximum of five) and it took between 2 and 4 minutes to execute a trade. These numbers have increased steadily: in 2016 a trade was done on average after three requests (with a maximum of 16 requests) and took between 6 and 15 minutes (Figures 4 and 5).
Figure 6 shows the proportion of bonds where the firm was unable to execute a trade at all in a specific bond during a given week. We calculate this metric by checking if within one week orders in a given instrument and size lead to a transaction or not. The percentage of bond transactions that could not be executed in a given week increased to about 10%-15% at the end of the sample period (2014-2016) from 5%-10% in 2009-2013.
Figure 4: Number of requests sent before execution
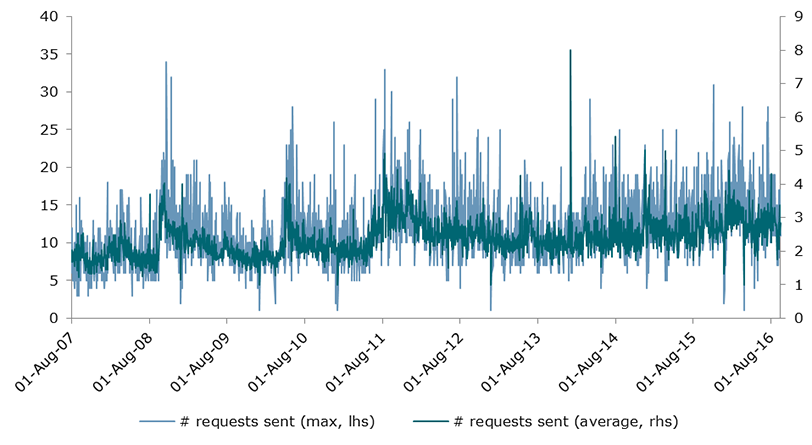
Source: Trade records from an anonymous firm
Figure 5: Time until execution (in minutes)
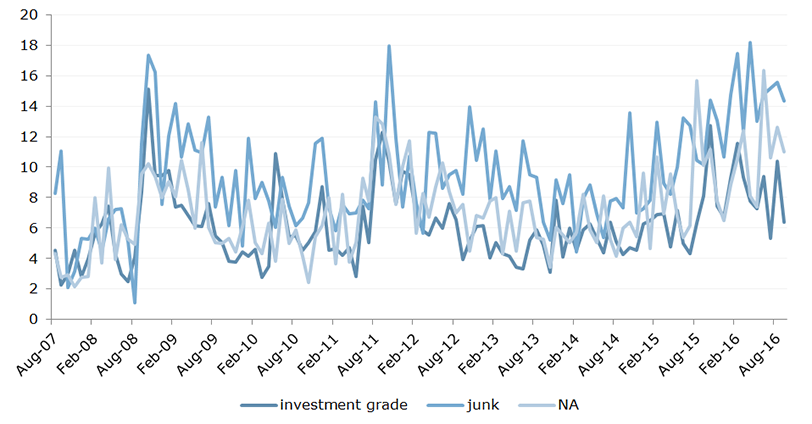
Source: Trade records from an anonymous firm
Figure 6: Percentage of bonds not able to be traded in a given week
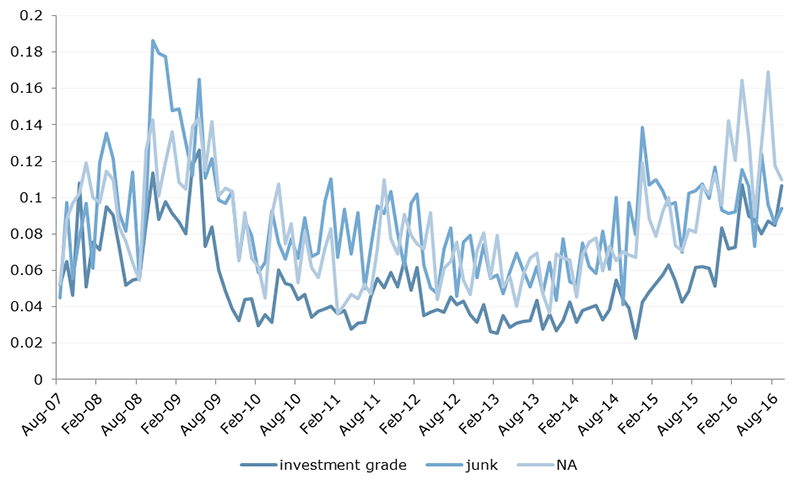
Source: Trade records from an anonymous firm
Caveats
These figures only relate to one firm’s trading experience. Different market participants will undoubtedly experience different trading conditions. Data from a much larger sample of market participants would be required to extrapolate the trends to the UK corporate bond market as a whole. However, many market participants say information about their unfilled and partially filled orders is not recorded in a way that can be quantitatively interrogated on an aggregated basis alongside other firms’ data, given the particular nature of bond trading and firms’ regular use of multiple trading protocols.
It is also plausible that some of the increased difficulty in trading is attributable to changes in the types of corporate bonds the firm traded during the sample period. For example, there appears to have been a large increase in US dollar denominated bonds traded by the firm, as well as a shift into sub-investment grade bonds. Another factor could be the firm’s increasing use of RFQs compared with orders.
Changing dealer behaviour and market structure
To shed some more light on the trading environment that market participants face we collected data relating to changing dealer behaviour from three UK electronic bond trading venues. These data pertain only to a portion of on-venue trades, whereas the most acute concerns about liquidity relate to the majority of trading in corporate bonds that occurs off-venue or OTC. Bonds traded on venues are generally considered more liquid (e.g. on-the-run or benchmark issues) and the trades requested are generally smaller in size, so this may not be entirely representative of overall corporate bond trading.
Figure 7 shows the average quote rate per dealer for GBP denominated corporate bonds across three UK electronic bond trading venues. In other words, the chart shows how frequently a dealer quotes a price back to a client in response to a request for a price. The quote rate has declined from about 60% several years ago (and as high as 65% in early 2014) to around 52% by mid-2016. We also show the average execution rate (i.e. how frequently an RFQ sent to one or more dealers actually results in a trade). The average execution rate has been much more stable, though it did decline from a peak of 78% in late 2014 to 71% in mid-2016. It is still above 2013 levels.
Figure 7: Average quote rate (per dealer) and execution rate (per RFQ) for GBP denominated corporate bonds traded on UK electronic platforms
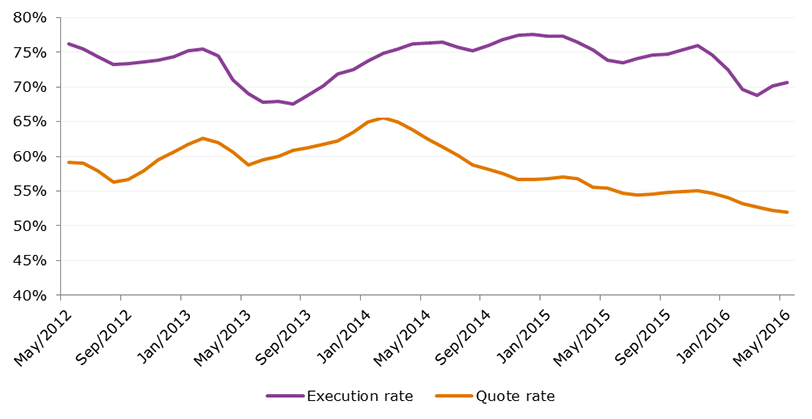
Source: Three electronic bond trading platforms, FCA calculations
Lower dealer quote rates could imply dealers are now less willing or able to provide quotes to clients. But this in and of itself does not necessarily establish that there has been a decline in liquidity. One potential contributing factor why the drop in average execution rates is less pronounced than the decline in average quote rates is that there has been an increase in the number of dealers that clients can send RFQs to at one time on certain platforms.
Another factor could be the introduction or more widespread use of additional innovative functionalities designed to improve execution rates on the electronic platforms. This includes, for example, providing 'axe' information about specific dealers (i.e. which ones already have a position in a given bond and are thus more likely to trade it). Other factors that could be affecting the quote and execution rates include changes to volatility and GBP specific drivers such as uncertainty caused by the referendum in June 2016; however, the limited data we received on quote and execution rates for euro-denominated corporate bonds displayed similar trends to GBP bonds.
Conclusion
Over the past several years there have been significant shifts in market structure. Some dealers are reportedly pulling back from providing market making services to some clients due to a combination of strategic, capital and regulatory factors.
Others are reportedly shifting, to some extent, from the traditional principal-based market making model to an agency (commission-based) or a 'riskless principal' model in which dealers seek to find both sides of the trade before committing capital6.
Other factors which may have impacted the way corporate bond markets function include but are not limited to:
- The large increase in corporate bond issuance – especially in high-yield debt – and therefore the amount of corporate debt outstanding.
- The effects of monetary policy and quantitative easing by central banks.
- Technological advances allowing dealers to communicate and facilitate the execution of trades with clients increasingly on electronic trading venues, especially for relatively standardized and smaller transactions.
- The huge growth in bond funds, including exchange traded funds (ETFs).
Our previous research showed liquidity recovering from post-crisis lows and remaining healthy in 2014. Our new findings confirm some of market participants’ concerns that corporate bond markets have become less liquid in recent years. However, overall the evidence indicates liquidity is still relatively healthy compared with the entire 2008-2016 period. We will continue to monitor liquidity conditions to assess whether the UK corporate bond market is functioning well.
Footnotes
- Bruce Mizrach, Analysis of Corporate Bond Liquidity, FINRA Office of the Chief Economist (December 2015).
- Autorité Des Marches Financiers, Study of liquidity in French bond markets (November 2015)
- International Organization of Securities Commissions, Examination of Liquidity of the Secondary Corporate Bond Markets, Consultation Report CR01/2016 (August 2016).
- Additionally, there is some evidence that effective bid-ask spreads have risen recently. See, e.g., ‘Effective market spreads’ for corporate bonds traded on Tradeweb, available in ICMA’s published response to the IOSCO consultation report, Examination of Liquidity of the Secondary Corporate Bond Markets (2016).
- When the firm can see a price for a given bond quoted on Bloomberg by one or more dealers, it tends to attempt to trade through orders or RFQs. Otherwise, the firm will bilaterally contact dealers via Bloomberg’s IB chat functionality, the telephone or other communication channels.
- See, Hendrik Bessembinder, Stacey E. Jacobsen, William F. Maxwell, & Kumar Venkataraman, Capital Commitment and Illiquidity in Corporate Bonds, (March 21, 2016).
Appendix
Sample selection
The data used for the transaction-based liquidity measures is based on our ZEN transaction reporting data. We take the following steps to obtain our final dataset:
- We extract all bond transactions for which we are the relevant competent authority.
- We keep all securities with Thomson Reuters Datastream type 'BD' (bonds) and Datastream industry types 'FIN' or 'IND' (excluding sovereign bonds and bonds issued by supranational institutions or agencies).
- We drop all bonds with CFI codes starting with 'DY' and 'DM' (money market instruments and miscellaneous debt instruments).
- We identify transactions reported by both a seller and a buyer and drop the duplicate transaction.
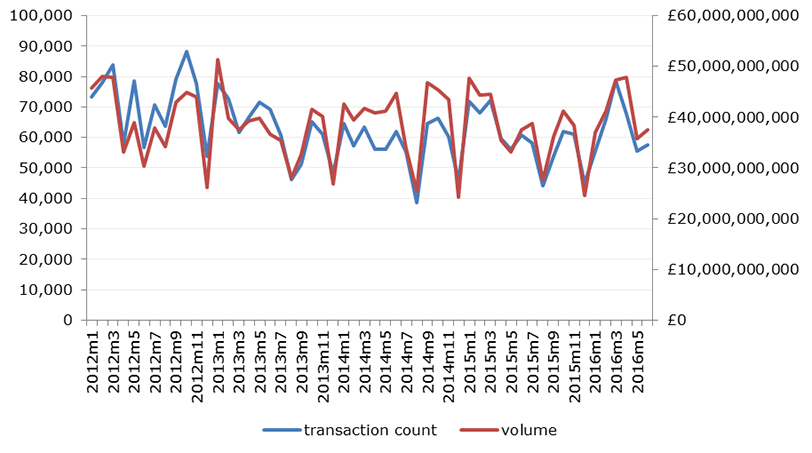
The resulting dataset contains about four million observations. The number of trades over time and the volume traded (in GBP and winsorized at the 0.5% level) are shown in Figure A.1. The transaction-based liquidity measures are then calculated as described in Occasional Paper 14 (note: an increase represents a decrease in liquidity.)
Figure A.1: Number of trades and volume
Transaction-based liquidity measures by issuer type
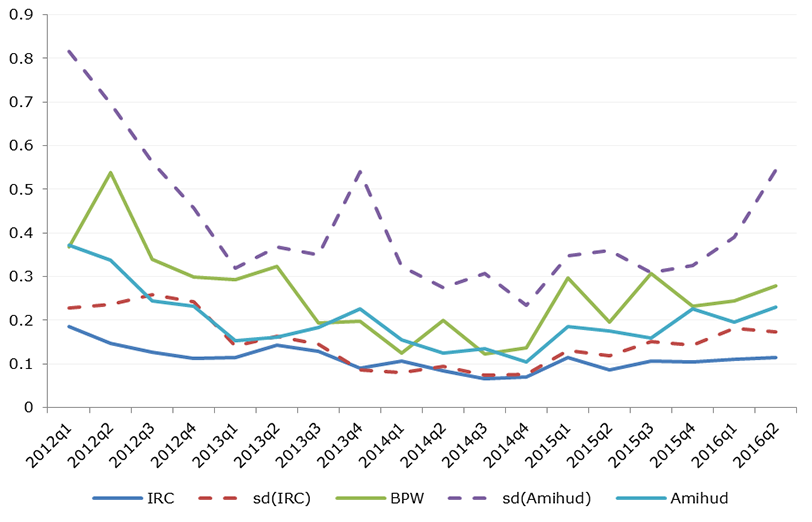
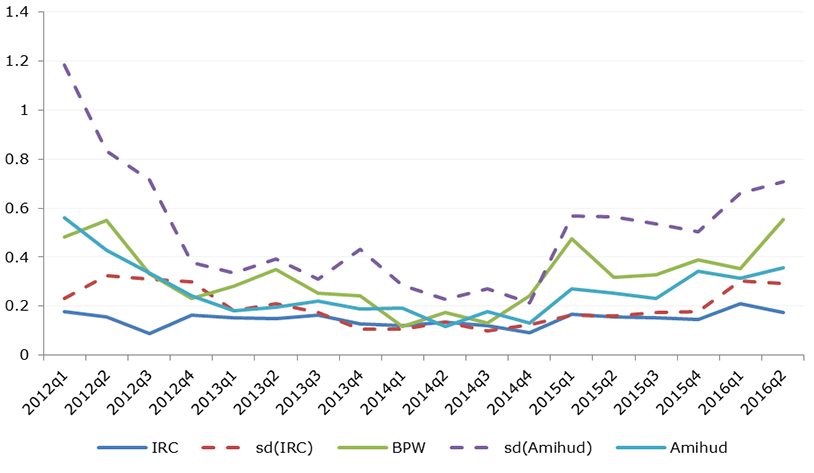
Using Thomson Reuters industry classifications we split the sample by issuer characteristics (Figure A.2 and Figure A.3). While the trends are similar the liquidity of non-financial bonds seems to be more volatile.
Figure A.2: Non-financial firms
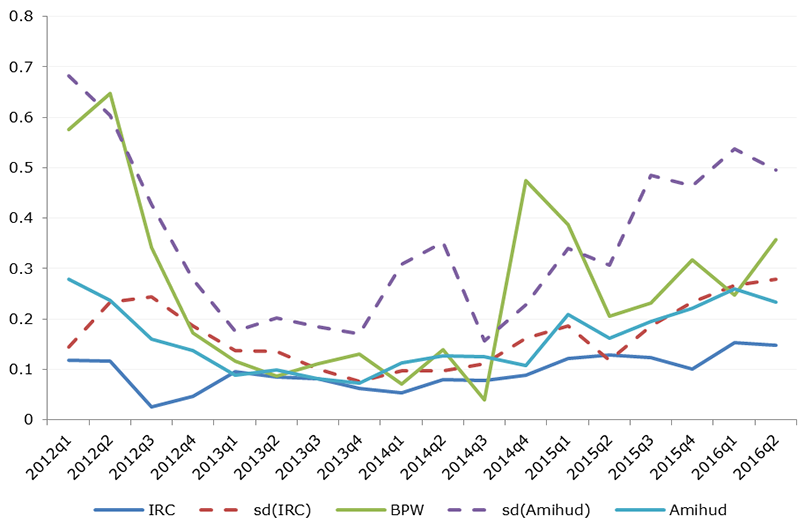
Figure A.2: Financial firms. Based on Thomson Reuters industry classification
Transaction-based liquidity measures by issue type
Figures A.4 – A.6 show liquidity measures by rating class and for GBP denominated bonds only. As we would expect the highly rated bonds are on average more liquid.
Figure A.4: Investment grade bonds
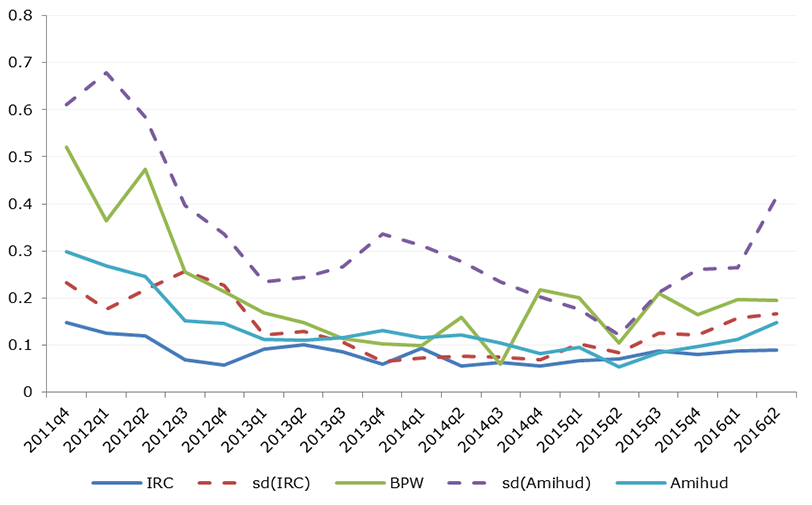
Figure A.5: Non-investment grade bonds
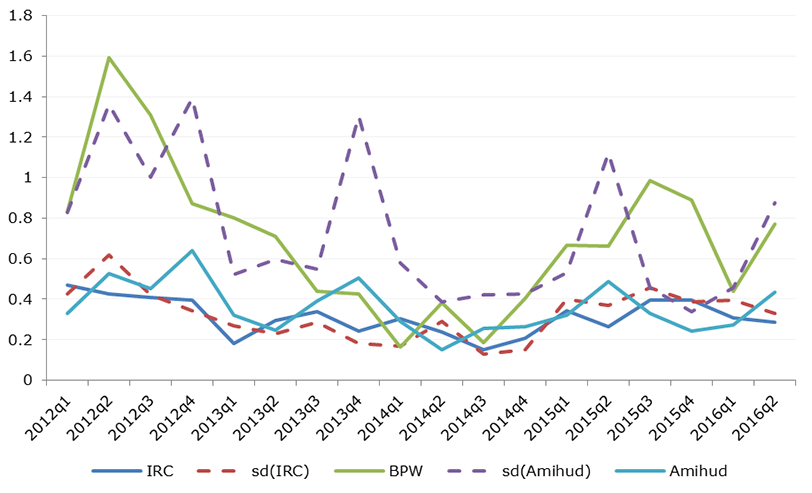
Figure A.6: GBP denominated bonds
Alternative liquidity measures
We calculate several alternative liquidity measures for the bonds represented in our dataset. Figure A.7 shows end-of-day quoted bid-ask spreads, calculated as: 'ask' minus 'bid' divided by 'ask', then multiplied by 100.
The spreads are based on quoted prices from iBoxx and Thomson Reuters. Both quote series show a downward trend but one should keep in mind that quoted bid ask prices are not necessarily representative in a mostly bilateral market.
Figure A.8 shows the transaction-based liquidity measures weighted by issue size. The trend is similar to the equally weighted measures implying that the results are not driven by the smallest bonds only.
In Occasional Paper 14 we calculated a composite liquidity measure based on the individual liquidity metrics. Figures A.9 and A.10 show the updated composite measure for the full sample and for each liquidity quartile separately (where Q1 is the most liquid and Q4 the least liquid quartile). In absolute terms, the least liquid segment became more illiquid than the more liquid segments, and the deterioration in liquidity started already in Q4 2014. Changes in liquidity are however very similar across quartiles.
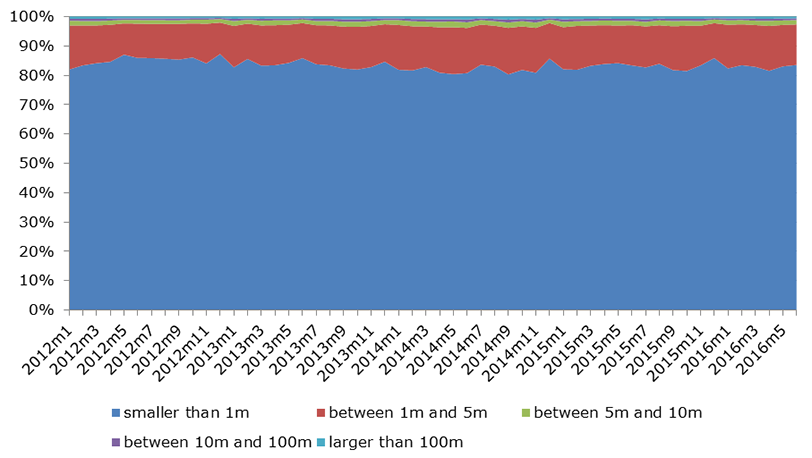
In relatively illiquid markets, it may be difficult to execute large trades. Figure A.11 shows the number of trades carried out by size buckets. Most trades are done in sizes lower than one million pounds notional and the proportion of large trades has remained relatively stable over the sample period.
Figure A.7: End-of-day quoted bid-ask spreads
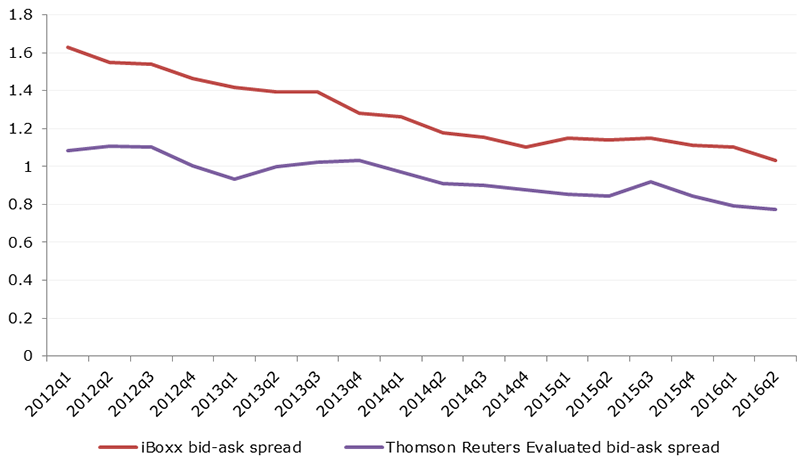
Figure A.8: Value weighted transaction based liquidity measures
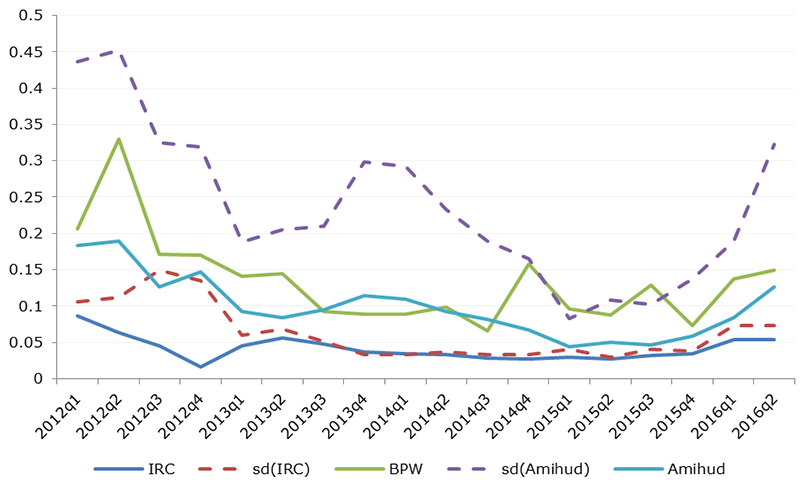
Figure A.9: Composite liquidity measure

Figure A.10: Composite liquidity measure by liquidity quartile
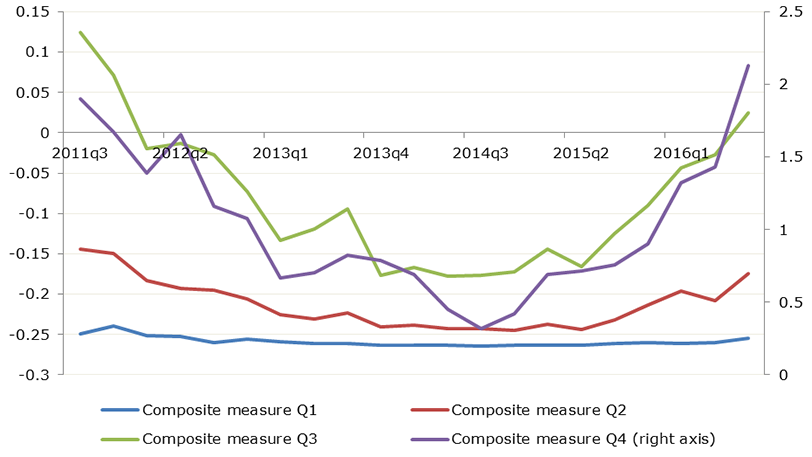
Figure A.11: Transaction sizes. Proportion of trades by size bucket (GBP)