The FCA collects complaints data from firms to enable us to monitor:
- the number of complaints that firms receive
- how this changes over time, and
- what products or services people have complained about the most.
We use the data to help assess how well they are treating their customers and how firms’ performance changes over time.
We publish complaints data every six months and this publication includes data for the first half (H1) of 2016 (1 January to 30 June 2016). We collect and publish data at both an aggregate (market level) and firm level, although we only publish firm specific data for firms reporting 500 or more complaints. Firms with 500 or more complaints in a half-year period are also required to publish complaints data on their website.
This publication analyses the aggregate complaints data and will specifically cover the following topics:
Total number of complaints opened:
- by product type
- by type of firm
- by cause of complaint
Complaints handling and the amount of redress paid to customers:
- complaints closed
- complaints upheld
- redress paid to customers
Full aggregated complaints data for the latest six-month period and the previous six-month periods are available using the following links:
- Tables 1 to 5: complaints data 1 January to 30 June 2016 (XLSX)
- Aggregate complaints data charts (PDF)
Changes coming next time
In April 2017 the FCA’s biannual complaints publication will change. This is when our new rules on improving complaints handling come in, which improve how we report and publish complaints (see PS15/19: Improving complaints handling, feedback on CP14/30 and final rules). The publication will provide a new, fuller data set. Although it will not be comparable to historic data we published, the new data set will be more informative for consumers and industry (e.g. it will include figures putting the number of complaints into context in relation to the size of each business), and will give us better intelligence.
We also aim to begin publishing a new section for consumer credit related data once all firms are authorised and submitting their complaints data to us.
For more information on the new complaints return which firms use to report their data to us, please refer to our Handbook.
Highlights for 2016 H1
- While current accounts are the second most complained about product, the total number of complaints fell during H1 2016.
- From 2010 to 2014 there had been a steady increase in the number of consumer complaints about mortgage products. They have remained mostly unchanged since the beginning of 2015.
- Personal investment firms have seen a 15% increase in the number of complaints they receive. Although absolute numbers are lower than for other types of firm, personal investment firms show the greatest percentage rise in complaints.
- Arrears related complaints have increased by 5% since 2015 H2. Although this is the greatest rise in percentage terms for complaint causes, they still only make up around 1% of all complaints.
- Complaints about advising, selling and arranging financial products declined the most in absolute terms, falling by just under 26,000, or just over 2%, since 2015 H2.
The total number of complaints opened
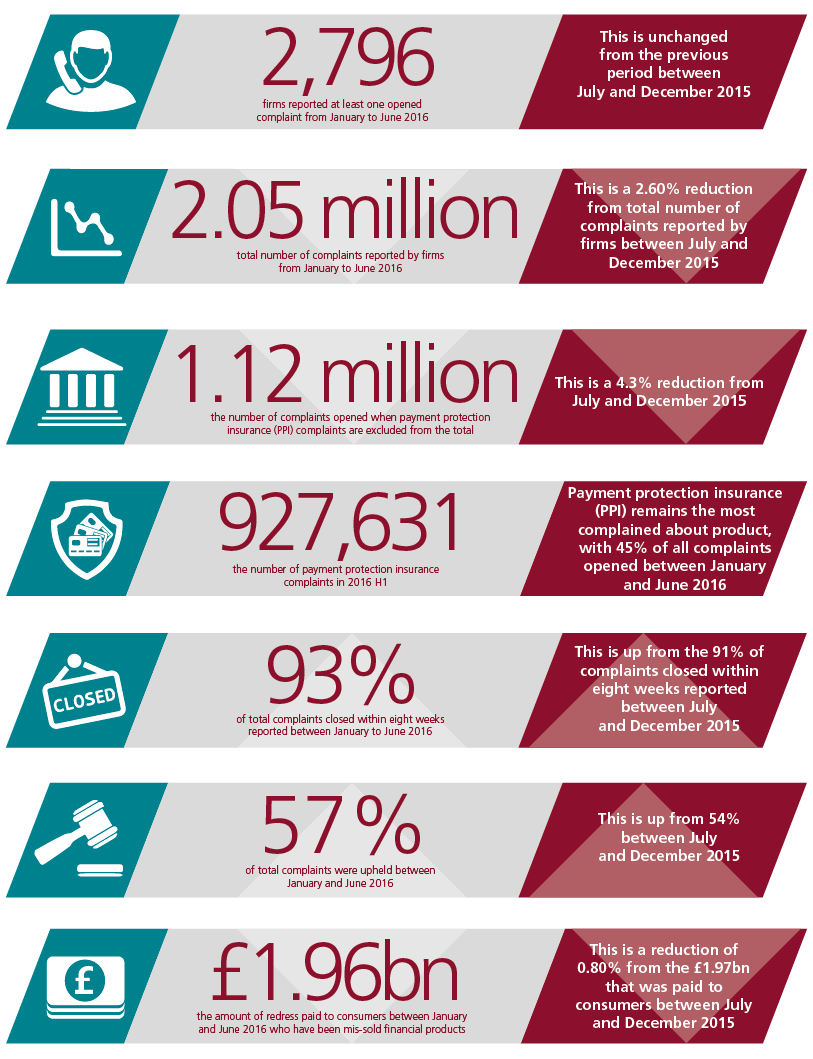
The total number of complaints firms have received reduced by 2.6% to 2.05m in 2016 H1, compared with 2015 H2. This is a decrease of nearly 40% since the peak in 2012.
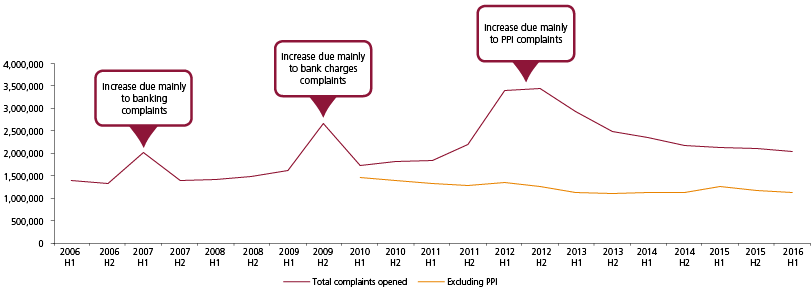
Figure 1: Total number of complaints opened
Opened complaints by product type (Table 2.1 and 2a)
Payment protection insurance (PPI) remains the most complained about product, with 927,631 complaints reported between January and June 2016. As such, PPI still accounts for 45% of all complaints. Excluding PPI, total complaints have decreased by 4% since the second half of 2015 to 1.12m. PPI is more than double the next most complained about product, current accounts, which received 407,954 complaints over the same period. However, out of all the reported products, current accounts have seen the largest reduction in complaint numbers – decreasing by over 46,000, or just over 10% – since the second half of 2015.
We classify complaints into five product groups. Figure 2 shows the proportion of complaints in each group and the top products complained about.
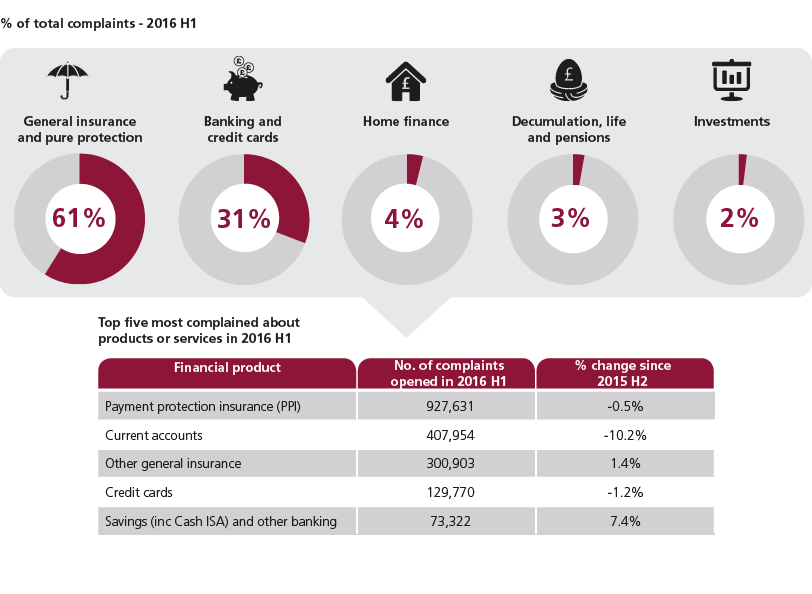
Figure 2: Complaints broken down by product type and the top five most complained about products or services in 2016 H1
Banking and credit card complaints
The number of complaints opened for ‘banking and credit card’ products in 2016 H1 was 633,620. This is 8% less than reported during 2015 H2, but is still 13% higher than the lowest level in 2014 H1.
- The number of credit card complaints decreased for the first time since 2014 H2 and totalled 129,770 in 2016 H1. This is 1.2% lower than in 2015 H2 and 19% higher than the lowest level recorded, in 2014 H2. Nevertheless, the number of complaints for 2016 H1 is 61% lower than the highest level recorded, in 2012 H1.
- Current account complaints have decreased by 10% since 2015 H2. The number recorded in 2016 H1 is 75% lower than the peak at the end of 2009, but still 42% higher than the lowest level observed in 2013.
- Complaints about savings (including Cash ISAs) and other banking issues increased in 2016 H1 to 73,322 – an increase of 7% since 2015 H2. However, this is 53% lower than the peak at the start of 2010.
Home finance complaints
The number of opened home finance product group complaints remained mostly unchanged since 2014 H2 at 76,137. The general trend from 2010 to 2014 had been growth in the number of complaints and they are still 31% higher than in 2010.
- Since 2015 H2 the number of equity release complaints has fallen from 991 to 780, representing a 21% decrease. This is still higher than the 383 opened complaints reported by firms in 2010 H2.
- There has also been a 7% decrease in the number of complaints regarding credit-impaired mortgages between 2015 H2 and 2016 H1. This is in line with the trend of falling sales of credit impaired mortgages since 2008.
For more information about the volumes of home finance business across the sector, which can be used to add more context to the home finance complaints figures, please see our Mortgage Lending Statistics.
Decumulation, life and pensions complaints
The number of complaints related to the decumulation(a), life and pensions group of products has been variable but on a general downward trend since 2010. Firms reported 56,629 opened complaints in 2016 H1, representing a decrease of just over 9% when compared with 2015 H2.
- The number of complaints related to endowment products peaked in the first half of 2011 and again in the first half of 2013. Since then there has been a significant reduction and the number declined again since 2015 H2 to 13,492 opened complaints in 2016 H1. This trend is consistent with the fall in sale of endowment policies since 2005.
- There was an upward trend in the number of complaints related to personal pensions between 2010 H1 and the peak in 2015 H1 with an overall increase of 78% during that time. Since then the number has been decreasing, by just under 15% between 2015 H1 and 2015 H2 and over 10% between 2015 H2 and 2016 H1 when the reported number was 27,386. The overall increase in complaints since 2010 is consistent with the increasing trend in personal pension sales over the same period.
General insurance and pure protection complaints
Following a significant rise, the number of complaints related to general insurance and pure protection peaked at almost 2.5m in 2012 H2. This was predominantly driven by PPI complaints. Since then the number of complaints has fallen to a current total of 1.25m – a reduction of 50%.
- PPI makes up the majority of complaints in general insurance and pure protection (74%) at just under 0.93m – a 0.5% fall since 2015 H2. The number reported is more or less unchanged since 2015 H2, but is 5% higher than the 0.88m reported in the same period last year (2015 H1).
- Other than PPI, firms reported 318,141 general insurance and pure protection complaints, representing a 1.7% increase when compared with 2015 H2.
Investments complaints
There was a 2.8% increase in the number of investment complaints between 2015 H2 and 2016 H1. However, the number is down by 18% when compared with the same period last year (2015 H1).
- The number of complaints relating to personal equity plans (PEPs)/ISAs (excluding cash ISAs) fell by over 5% between 2015 H2 and 2016 H1 to 11,203.
- The number of complaints regarding investment management/services (including platforms) increased by over 29% between 2015 H2 and 2016 H1 to 6,879. This is more or less unchanged on the same period last year (2015 H1), and is 18% down when compared with the peak at the end of 2013.
- Complaints relating to investment bonds increased by 3.3% between 2015 H2 and 2016 H1 to 6,404. However, this is 8% down when compared with last year (2015 H1) and 48% down when compared with the previous high point reported in 2011. This is consistent with the continued decline in the sale of investment bonds.
Complaints by firm type (Table 2.2)
The majority of consumer complaints (64%) were made to banks and building societies, who received the same proportion of complaints as during the last half-year. However, banks and building societies also saw the largest absolute reduction in the total number of complaints between 2015 H2 and 2016 H1. The total number of opened complaints fell by 42,949 (3.2%) to 1,313,242. There has been a steady decline in the numbers reported since 2012.
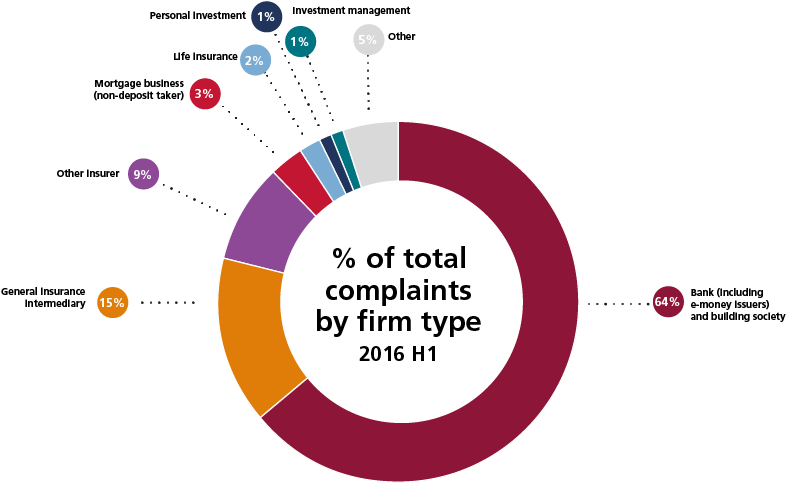
Figure 3: Percentage of total complaints opened by firm type
- Complaints against personal investment firms saw the greatest increase in percentage terms between 2015 H2 and 2016 H1 – rising 15% – but numbers are relatively low when compared with other types of firms.
- Complaints against investment management firms reduced by just under 10% to 11,259 complaints opened in 2016 H1.
Complaints by cause (Table 2.3)
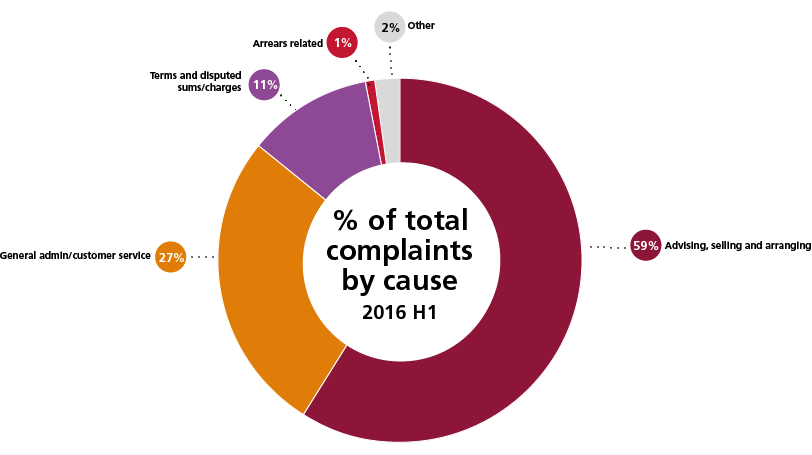
Figure 4: Percentage of total complaints opened by cause
Advising, selling and arranging issues account for 59% of the total complaints received in 2016 H1 and are the main cause of complaints. This is mainly due to the general insurance and pure protection product group, which includes PPI.
- General administration and customer service related complaints decreased by 1.3% when comparing 2016 H1 with 2015 H2. They reduced in absolute terms by just over 7,100 complaints.
- Advising, selling and arranging related complaints decreased by just over 2% to 1.21m in 2016 H1.
- Arrears related complaints increased by 5% to 28,211 in 2016 H1, although they make up around 1% of all complaints.
- Complaints about terms and disputed sums or charges decreased by 7% between 2015 H2 and 2016 H1 to 219,364.
- When looking at both cause and product group (Table 1) advising selling and arranging complaints for the banking and credit card group of products fell the most in absolute terms by just under 19,000 to 218,936 in 2016 H1 – representing an 8% decrease between 2015 H2 and 2016 H1.
Complaints handling and the amount of redress paid to consumers
When consumers make complaints against firms we expect those complaints to be handled properly and resolved fairly and effectively. We have identified a few instances of significant failings in the way certain financial products were sold. This led us to work with firms to ensure complaints are handled appropriately and consumers are appropriately redressed. In recent years this includes failings in the sales of PPI and interest rate hedging products (IRHPs) and substantial redress relating to these products is still being paid.
Complaints closed (Table 3.1)
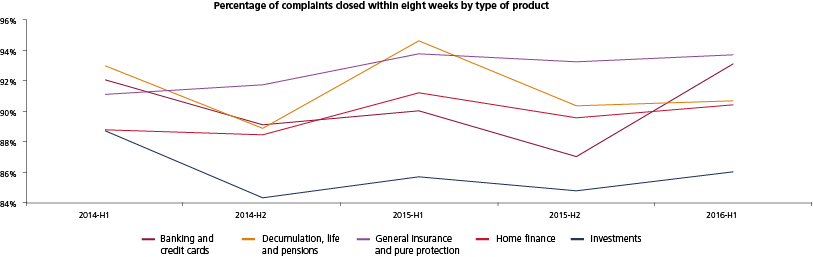
Figure 5: Percentage of complaints closed within eight weeks by type of product
Figure 5 shows the number of complaints closed within eight weeks of being opened. These are split by product category. There is a downward trend across most product categories (except for general insurance and pure protection, which includes PPI) since 2013 to the end of 2015, followed by an increase in 2016 H1.
- In 2016 H1, over 93% of all complaints were closed (1.91m) within a period of eight weeks, compared to 91% reported in 2015 H2.
- The largest increase since 2015 H2 in complaints closed within eight weeks occurs in the ‘banking and credit cards’ product group (from 87% to 93%).
- 97% of complaints made against non-deposit taking mortgage firms were closed within eight weeks in 2016 H1. This is down slightly since 2015 H2, but still represents the highest proportion of complaints closed within eight weeks among all firm types.
Complaints upheld (Table 4.1)
The proportion of complaints about financial products that were upheld (when the firm agrees with the complainant) in 2016 H1 was 57%, an increase on the 54% of complaints that were upheld in 2015 H2.
- The proportion of upheld complaints varies across all product categories and firm types, with non-deposit taking mortgage businesses increasing their uphold rate by 4% from 2015 H2 to 2016 H1 to 44%.
- The upheld rate for general insurance and pure protection products (which includes PPI) was the highest across all product groups at nearly 64% in 2016 H1 – and is an increase when compared with 61% in 2015 H2.
- The upheld rate for the banking and credit card product group was 47% for 2016 H1, up from 44% in 2015 H2.
Redress paid to consumers (Table 5.1)
The amount of redress paid to consumers was £1.96bn in 2016 H1, 0.8% lower than the redress paid in 2015 H2.
- There was a 6% increase in payments related to the general insurance and pure protection group of products, which accounted for 87% (£1.71bn) of all redress payments in 2016 H1. This product group contains redress paid for PPI products.
- All other product categories saw a reduction in redress payments in 2016 H1, except for the home finance group of products which increased by over 2% from 2015 H2.
- The top ten firms paid 85% of the total redress given to consumers in 2016 H1. This is broadly consistent with the previous period during which the top ten firms accounted for 83% of total redress paid to consumers.
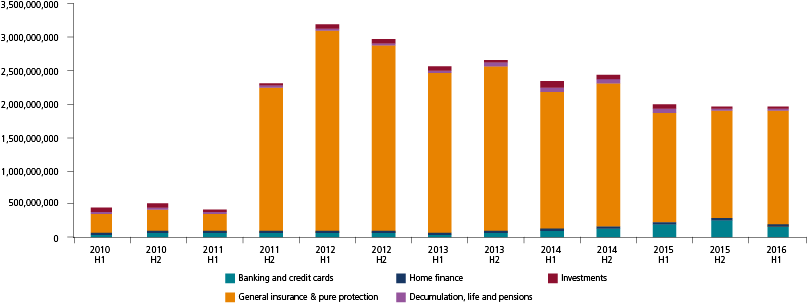
Figure 6: Redress paid by type of product
2014-H2 | 2015-H1 | 2015-H2 | 2016-H1 | ||||
|---|---|---|---|---|---|---|---|
| Redress paid by type of product (Note 1) | Total £ | Total £ | Total £ | Total £ | |||
| Banking and credit cards | 144,783,496 | 212,385,691 | 268,585,686 | 150,966,420 | |||
| Decumulation, life and pensions | 49,223,049 | 40,169,423 | 35,954,145 | 34,566,405 | |||
| General insurance & pure protection | 2,153,568,577 | 1,645,908,748 | 1,606,653,098 | 1,710,702,541 | |||
| Home finance | 16,808,505 | 16,030,426 | 18,810,406 | 19,218,921 | |||
| Investments | 73,858,502 | 62,721,128 | 44,157,690 | 43,472,637 | |||
| Total | 2,438,242,129 | 1,977,215,416 | 1,974,161,025 | 1,958,926,924 | |||
About this data
Prior to 29 June 2016, we did not require firms to submit complaints data for complaints that are resolved by the end of the following business day after they are received. This rule is set out in our Handbook at DISP 1.5. From 30 June 2016 the rule changed so that all complaints become reportable and the new data should therefore feed into the next complaints data publication due in April next year. The amendments to DISP 1.5 were discussed in Policy Statement 15/19.
The data in this publication do not cover complaints against firms authorised only to carry out consumer credit related activities. We will not publish data for these firms until after March 2017 when all firms carrying out these activities are authorised and are reporting their complaints data to us. Please see the consumer credit pages on our website for more information.
Figures reported in this publication for the previous two periods (2015 H1 and 2015 H2) have been restated since the previous publication due in part to resubmissions by firms and a recalculation of the data.
Notes
H1 means first half of the year (1 January to 30 June), H2 means second half of the year (1 July to 31 December).
(a) ‘Decumulation’ means the conversion of pension assets accumulated during working life into pension income to be spent during retirement.