This data includes all the complaints that firms report to us.
We collect complaints data from firms to enable us to monitor:
- the number of complaints that firms receive
- how this changes over time, and
- what products or services people have complained about the most.
We use the data to help assess how well they are treating their customers and how firms’ performance changes over time.
We publish complaints data every six months and this publication includes data for the second half (H2) of 2016 (for firm returns with a half-year period ending between 1 July to 31 December 2016).
We collect and publish data at both an aggregate (market level) and firm level, although we only publish firm-specific data for firms reporting 500 or more complaints in a half-year period or 1,000 or more if firms report to us annually. This currently makes up around 97% of complaints reported to us. Firms exceeding these thresholds are also required to publish complaints data on their websites.
Changes to the data for 2016 H2 (1 July to 31 December)
Following changes to our rules in December 2015, as outlined in PS15/19, the data firms now report to us on their complaints have changed. Although they are not fully comparable to historic data we published, we believe the new data set is more informative. For example, it provides an increased product breakdown, it puts the number of complaints into context in relation to the size of each business, and as a result gives us better understanding of what is happening within the sectors we regulate.
H1 means first half of the year (1 January to 30 June), H2 means second half of the year (1 July to 31 December).
The changes now affect the number of complaints published
These rule changes also increase the number of complaints reported to us, as all complaints are now covered – previously complaints closed before the close of the next business day after they were opened were not covered in these data.
It is important to note that, had these changes been implemented earlier to include the first half of 2016, and based on data supplied to us by a sample of large banking groups – accounting for approximately 55% of all reported complaints in 2016 H2 - we estimate that the total number of complaints actually decreased when comparing 2016 H1 with 2016 H2 by approximately 14%. The total number of opened complaints reported in 2016 H2 was 3.04 million.
Firms’ reporting periods have affected the data
In 2016 H2, only 44% of firms submitted data using the new return while 56% of firms were still reporting to us using the old return. This is due to firms submitting their data to us in line with their own financial year end date, meaning they can have different reporting periods. As a result, not all firms have yet submitted the new return.
However, firms using the new return account for approximately 90% of complaints, 10% of complaints were reported on the old return. You can see firms’ reporting periods in our firm specific data for those reporting 500 or more complaints in the six-month period.
The categories on the new return have now changed
Our data are now split into 5 broad product groups and in turn these are then split into 50 new product or service categories. Some of the new categories are not directly comparable to previous ones. For example, the ‘Decumulation and pensions’ product group used to be ‘Decumulation, life and pensions’, while ‘Insurance and pure protection’ product group used to be ‘General insurance and pure protection’. In the light of this, and the other reporting changes mentioned above, and as some firms have reported using the old return, we are not providing trend analysis or a fuller analysis of complaints about product categories in this publication, but will in future publications.
Other aspects to consider when looking at our new complaints data
Our analysis is based on the data supplied to us by firms in the new return and as such may be subject to possible reporting errors as firms get used to submitting the new data to us. We have carried out checks to seek to identify and correct errors where we are able to.
The aggregate data do not include complaints against firms that are only authorised to carry out consumer credit related activities. This is because not all firms have submitted the data to us yet following their authorisation process and, as a result, we do not yet have a full set of data. We will not be publishing aggregate statistics for all firms until they are authorised and are reporting their complaints data to us expected in 2018.
This publication analyses the aggregate complaints data and will specifically cover the following topics:
- highlights for 2016 H2 (1 July to 31 December)
- putting complaints into context
- most complained about products
- main reasons for complaints
- complaints by product group – highlights
- outcomes for consumers
Full aggregated complaints data for the latest six-month period and the previous six-month period are available using the following link:
Tables 1 to 5: aggregate complaints data (XLSX)
Highlights for 2016 H2
All complaints | Excluding PPI | ||||
|---|---|---|---|---|---|
| Total number of firms reporting one or more complaint | 2,977 | - | |||
| Total number of opened complaints reported by firms | 3.04 million | 2.15 million | |||
| PPI remains the most complained about product | 895,110 | - | |||
| Percentage of complaints closed within three days (this is a brand new metric in the new return) | 43% | 63%* | |||
| Percentage of complaints closed within eight weeks | 97% | 97%* | |||
| Percentage of complaints upheld (where the firm agreed with the complainant) | 60% | 59%* | |||
| Total redress paid to consumers | £1.9 bn | Approximately | |||
*Only available for firms reporting on the new return
Putting complaints into context
For the first time, for firms which have submitted the new return, we are able to calculate the total number of complaints as a proportion of the total number of products they relate to. This enables us to show the number of complaints in relation to the size of each market or firm, which improves our comparison and benchmarking of complaints across different firms – this is shown in our firm specific data. For example, in the 2016 H2, there were approximately 3.6 complaints for every 1,000 banking or credit card accounts.
Firms are required to submit either a ‘provision’ measure (the total number of accounts or insurance policies a firm maintains for customers at the end of the reporting period) or an intermediation measure (the number of products they sell, advise or arrange for customers within the half-year reporting period). This will depend on the type of business a firm undertakes or the type of complaints they receive.
The table below shows the total complaints as a ratio of the context measure for each type of product. For example, the number of banking and credit card complaints for every 1,000 accounts.
| Provision: Median of firm ratios | Number of firms in sample | Intermediation: Median of firm ratios | Number of firms in sample | ||
|---|---|---|---|---|---|
| Banking and credit card complaints per 1,000 accounts | 3.61 | 41 | |||
| Decumulation* and pensions complaints per 1,000 policies in force | 1.53 | 35 | |||
| Home finance complaints per 1,000 balances outstanding | 8.02 | 40 | |||
| Insurance complaints per 1,000 policies in force | 3.23 | 112 | Insurance complaints per 1,000 policies sold | 21.69 | 31 |
| Investments complaints per 1,000 client accounts | 1.99 | 46 |
*Decumulation means the conversion of pension assets accumulated during working life into pension income to be spent during retirement.
Most complained about products
- PPI remains the most complained about product with 895,000 complaints in 2016 H2 making up 29% of all complaints compared with 45% in 2016 H1 under the old reporting requirements.
- Current accounts received around 514,000 complaints, making up 17% of all complaints, compared with 20% in 2016 H1 – this previously included all types of current accounts, including packaged account complaints which are now reported separately.
- Credit cards received approximately 313,000 complaints in 2016 H2, 10% of all complaints, this compares with 6% in 2016 H1.
- Motor and transport insurance, new to our list of products, received over 220,000 complaints - 7% of complaints.
- Packaged back accounts – also new to our list of products - was the fifth most complained about product, with just over 172,000 complaints, making up approximately 6% of all complaints.
For a full list of product or service complaints, please refer to Table 2a in our main statistics tables.
Main reasons for complaints
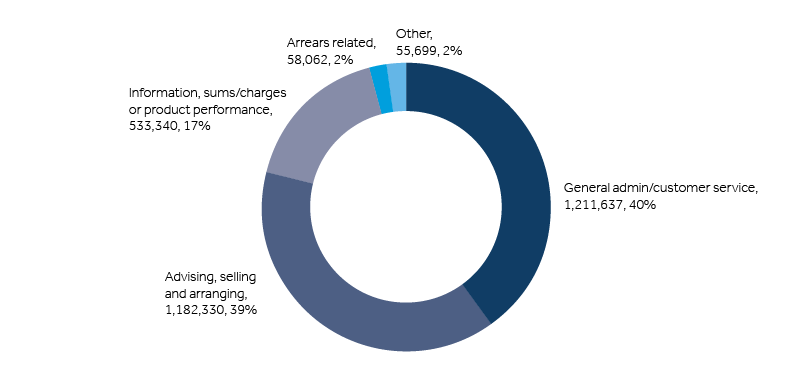
On our new return, we classify the reasons for a complaint into 5 broad cause groups as listed in the chart below. For firms submitting 500 or more complaints within a half-year period, these categories are then broken down further into ten cause categories. We aim to publish more data on this next time (autumn 2017) when we will have information for all firms submitting the new return.
The top two reasons, receiving nearly 80% of complaints in 2016 H2, were general administration and customer service together with advising, selling and arranging of products.
Causes of complaints 2016 H2
Complaints by product group – highlights
The chart below shows how complaints are split into the 5 product groups in 2016 H2.
Complaints by product group 2016 H2
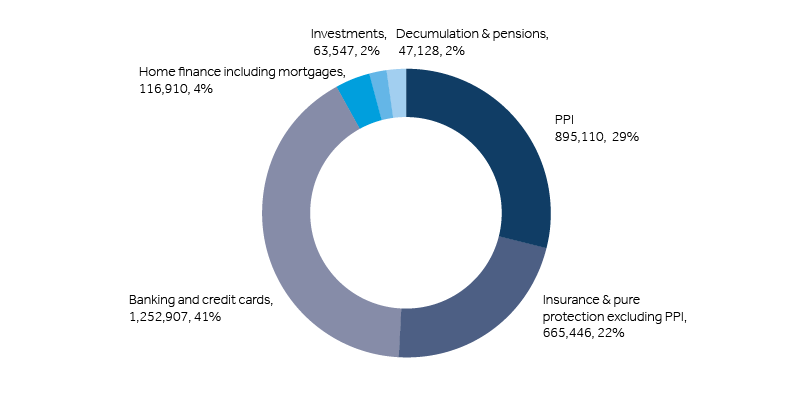
*Product categories have changed - ‘Decumulation and pensions’ used to be ‘Decumulation, life and pensions’, while ‘Insurance & pure protection’ used to be ‘General insurance & pure protection’, as discussed below.
Below we provide more detailed analysis of each product group and some of the most complained about products within each group
Banking and credit card complaints
As mentioned above, current accounts received around 514,000 complaints, making up 17% of all complaints, compared with 20% in 2016 H1. Credit cards received approximately 313,000 in 2016 H2, 10% of all complaints, this compares with 6% in 2016 H1. Packaged back accounts, the fifth most complained about product, had just over 172,000 complaints, making up approximately 6% of all complaints.
In addition, savings products (including ISAs) generated more than 68,000 complaints in 2016 H2, while unregulated loans and overdrafts had over 55,000 complaints.
97% of all banking or credit card complaints were closed within eight weeks by firms, while approximately two thirds were closed within three days. 58% of complaints were upheld (where the firm agreed with the complainant) and a total of just over £211 million was paid out in redress in the 2016 H2.
Decumulation and pensions
The list of products classified in this group has changed considerably since the previous publication and focuses solely on decumulation and pension product complaints. It no longer covers life insurance complaints which have now moved to the insurance and pure protection grouping (see below).
Non-workplace personal pensions, which includes self-invested personal pensions (SIPPs), stakeholder pensions (SHPs) and personal pension plans (PPPs), received more than 25,000 complaints in 2016 H2 which is the greatest number of complaints in this product category. Workplace pensions generated nearly 9,000 complaints in the same period. These are new product categories reported on our return. Annuities recorded over 5,000 complaints and drawdown and uncrystallised funds pension lump sums (UFPLS) had over 2,500 complaints.
90% of all decumulation and pension complaints were closed in eight weeks, with approximately 37% closed in three days. 64% of complaints were upheld and just under £21.5 million was paid to consumers in redress.
Home finance – including mortgages
Regulated home finance products generated around 95,000 complaints in 2016 H2, while unregulated products had around 16,000 complaints. There were just fewer than 2,000 complaints about second and subsequent charge mortgages and 2,200 for impaired credit mortgages. Equity release products received around 1,300 complaints.
95% of all home finance complaints were closed within eight weeks, while 44% were closed within three days. 60% of complaints were upheld and around £23 million was paid in redress.
Insurance and pure protection – including PPI
This category has also changed considerably since the previous publication and now includes life insurance products which were previously covered under the old ‘Decumulation, life and pensions’ product group.
Insurance product complaint numbers are also broken down more than in previous publications. We can see from the new return submissions that, after PPI, motor & transport insurance (mentioned above) and ‘other’ insurance products, the most complained about insurance products are property insurance, receiving approximately 78,000 complaints in 2016 H2, followed by medical or health insurance which received around 41,000 complaints. Whole of life, term or critical illness products received approximately 24,000 complaints.
97% of all insurance and protection product complaints were closed in eight weeks, while 27% were closed within three days – the lowest of all product groups. 63% of complaints were upheld while £1.59 billion was paid in redress – 83% of all redress paid in 2016 H2 (this includes PPI redress).
For firms which have reported the new return, when excluding PPI from this product group, we can see that 97% of complaints were closed within eight weeks, while 59% were closed in three days. 59% of complaints were upheld and approximately £38 million was paid in redress. Over 95% of insurance and protection redress was for PPI.
Investments
The investment product group also has many more product categories than in our previous publications and we can see from the figures that investment ISAs received around 14,600 complaints in 2016 H2, while investment bonds received approximately 9,300 complaints. Unit trust or open ended investment companies (OEICs) received around 6,000 complaints while 5,300 complaints were received about platform services.
92% of complaints about all investment products were closed within eight weeks, while 35% were closed within three days. 51% of complaints were upheld and approximately £58 million was paid in redress.
Outcomes for consumers
Below we show how complaints were handled in 2016 H2 when comparing between the different product groups as discussed above. We can see what proportion of complaints were upheld, how quickly they were closed by firms and how much redress was paid.
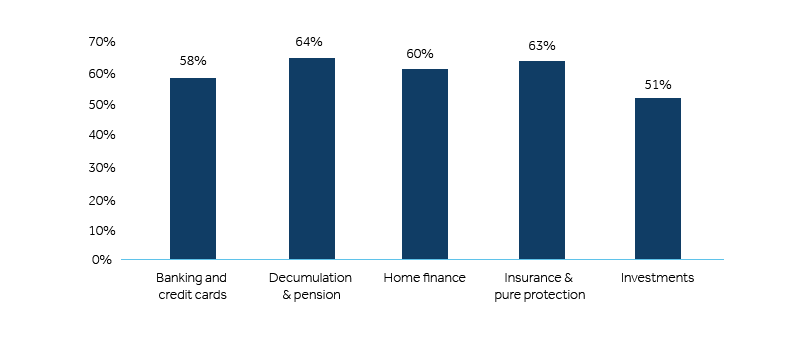
Percentage of complaints upheld by product group
The chart below shows that in 2016 H2, while 64% of closed complaints were upheld in favour of the consumer for decumulation and pension products and insurance and pure protection products, only 51% of investment complaints were upheld.
Percentage of complaints upheld by product group 2016 H2
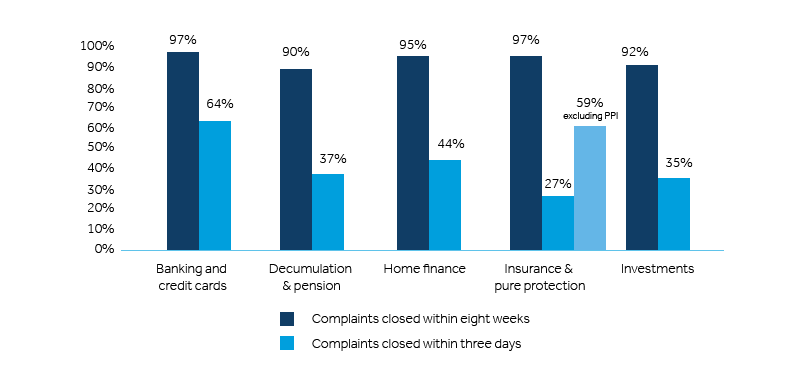
Percentage complaints closed within eight weeks and three days by product group
We can see in the chart below that there is quite a wide variation in the percentage of complaints closed within three days between product groups. If you exclude PPI products from insurance and protection products, 59% of complaints were closed within three days. Nearly two-thirds of banking or credit card products were closed within three days. Just over a third of decumulation and pension products and investment products were closed within three days.
Percentage of complaints closed within eight weeks, and three days, by product group 2016 H2
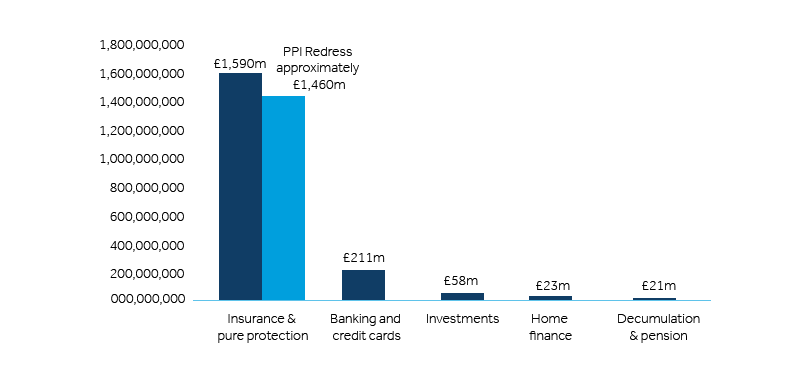
Redress paid (£) by product group
In total £1.9 billion has been paid out in redress in 2016 H2 – this has been broken down as in the chart below. Over 95% of redress paid for insurance and protection products was for PPI.
Redress paid (£) by product group 2016 H2