This page gives a breakdown of retail investment products sales data (PSD) from 1 January 2020 to 31 December 2024.
We have included the 29 different retail investment products and have grouped these into 8 distinct product categories, as shown in Table 1 below. For these 8 product categories, we break down these product sales further by detailed product categories.
Table 1: Retail investments PSD product categories
| Product Categories | Detailed Product Categories | Product Type Name |
|---|---|---|
| Endowments | Endowments | Endowment Savings Plan |
| Mortgage Endowment | ||
| With-profit Endowment | ||
| Bonds | Other Bonds | Distribution Bond |
Guaranteed Income/Growth/ Investment Bond | ||
| Trustee Investment Bond | ||
| Unit Linked Bond | Unit Linked Bond | |
| With-profit Bond | With-profit Bond | |
| Trusts, OEICs and SCARPs | Trusts, OEICs and Structured Capital At Risk Product (SCARPs) | Investment Trust |
Structured Capital At Risk Product | ||
| Unit Trust / OEIC | ||
| ISA | ISA | ISA |
| Long-term Care Insurance | Long-term Care Insurance | Long-term Care Insurance |
| Decumulation Products | Annuities | Life Annuity |
| Pension Annuity | ||
| Income Drawdown | Income Drawdown | |
| Occupational Pensions | Occupational Pensions | AVC Group Money Purchase |
| Executive Pension | ||
| Group Money Purchase | ||
| Group Section 32 Buy Out | ||
Small Self Administered Scheme (SSAS) | ||
| Personal Pensions | Group Personal Pension | Group Personal Pension |
| Other Personal Pensions | FSAVC | |
| Individual Pension Transfer | ||
| Pension Opt Out | ||
| Section 32 Buy Out | ||
| Personal Pension | Personal Pension | |
| Self Invested Personal Pension (SIPP) | Self Invested Personal Pension | |
| Stakeholder Pension | Stakeholder Pension |
We also provide a breakdown by financial sectors, which are based on the portfolios into which we divide firms. Firms in the Retail Banking sector, Retail Lending sector, General Insurance and Protection sector, Wholesale Financial Markets sector and firms with no assigned sector have been grouped as the ‘Other Portfolio Sector’ to keep confidentiality where firm numbers are low. Please note that sector information is based on the portfolio of the provider firm.
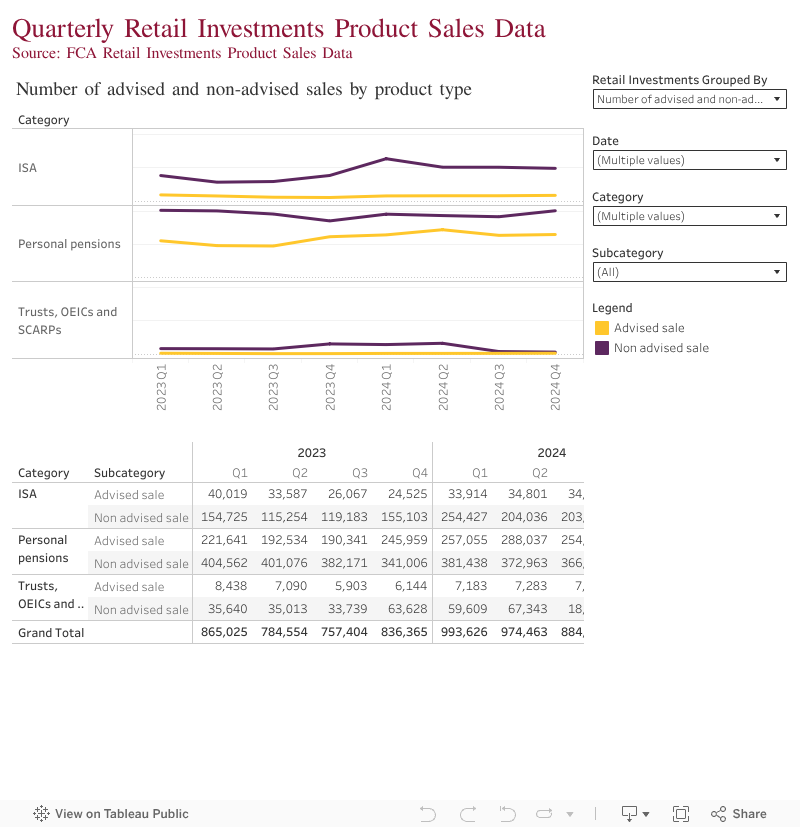
The interactive charts below present a selection of findings from the retail investments PSD set.
How to use the interactive charts
To use the charts, there are 4 filters to choose from:
- Retail Investments grouped by – use this to view the retail investments data split by a mix of characteristics, product groups or sectors.
- Date – use this to select one or more time periods
- Category – this allows you to select one or more product categories
- Subcategory – when available, this allows you to drill down into the product categories to view the detailed product categories
The data is correct as of 6 August 2025. Due to a combination of data resubmissions and adjustments, the data is not comparable to data within previous PSD publications.
Download the underlying data for the Tableau dashboard (XLSX)
Quarterly Retail Investments PSD dashboard
View the Retail Investments Product Sales Data dashboard in Tableau