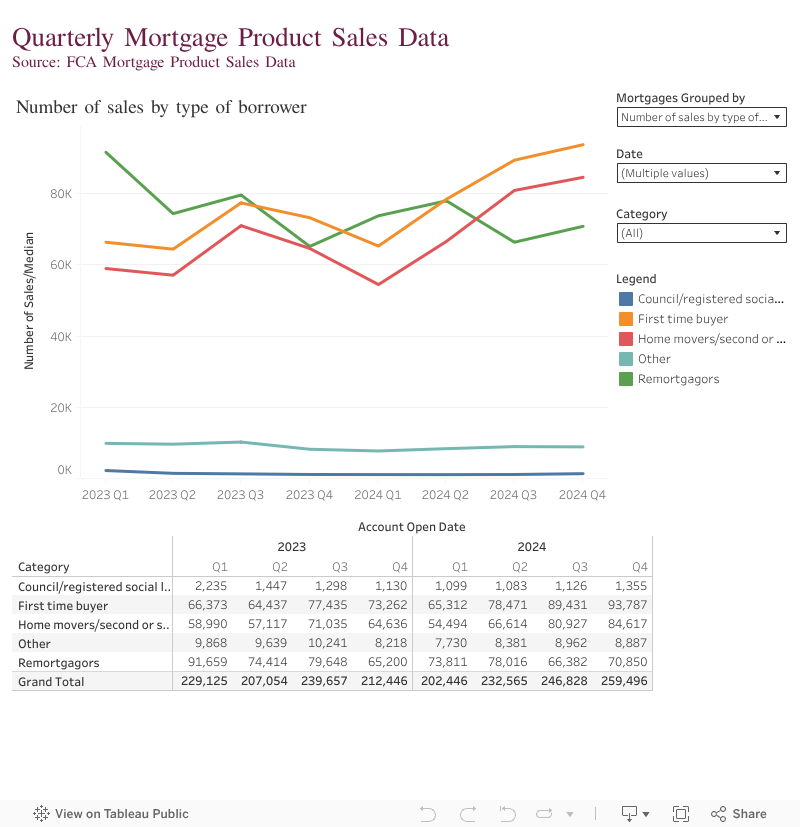
This page gives a breakdown of mortgage and remortgage product sales data (PSD) from 1 January 2020 to 31 December 2024.
The interactive charts and maps below present a selected mortgage PSD set.
How to use the interactive charts
To use the charts and maps, there are 3 filters to choose from:
- Mortgages grouped by – use this to view the mortgage data split by 18 mortgage groupings
- Category – this allows you to explore further each mortgage grouping
- Date – use this to select one or more time periods
The data in these charts is correct as of 8 August 2025. Due to a combination of data resubmissions and adjustments, the data is not comparable to data within previous PSD publications.
Please note that for this year’s mortgage sales data, we have used the Office for National Statistics Postcode Directory (ONSPD) as our reference source data instead of the Royal Mail Postcode Address File (PAF).
Download the underlying data for the Tableau dashboards:
PSD Mortgages quarterly data (XLSX)
PSD Mortgages monthly data (XLSX)
PSD Mortgages dashboards
Quarterly PSD Mortgage data charts by UK geographic area dashboard
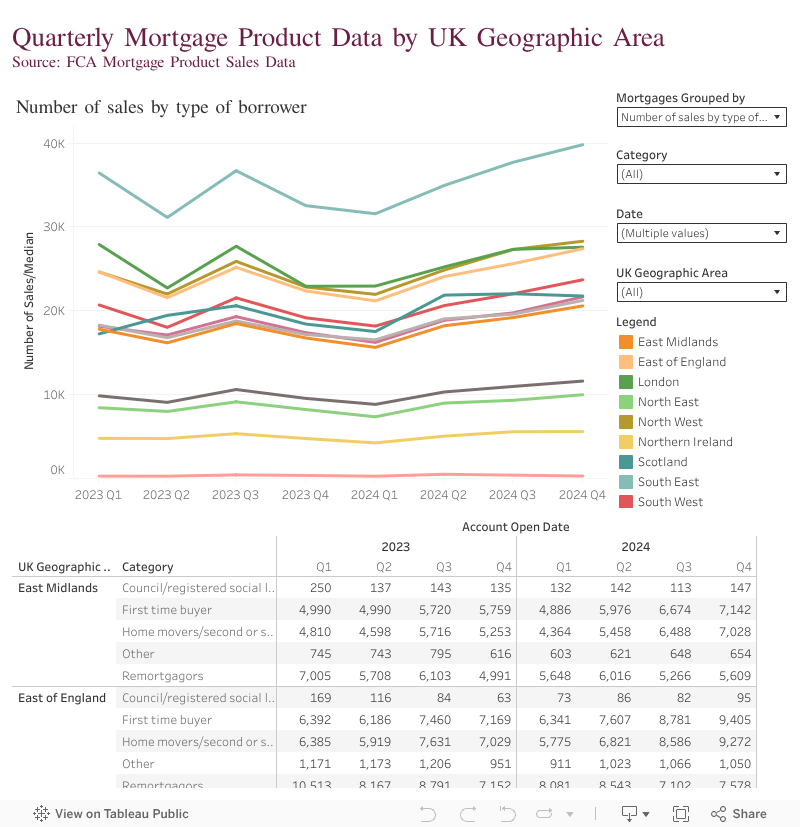
View Quarterly PSD Mortgage data charts by UK geographic area in Tableau
Quarterly PSD Mortgage data maps by UK geographic area dashboard
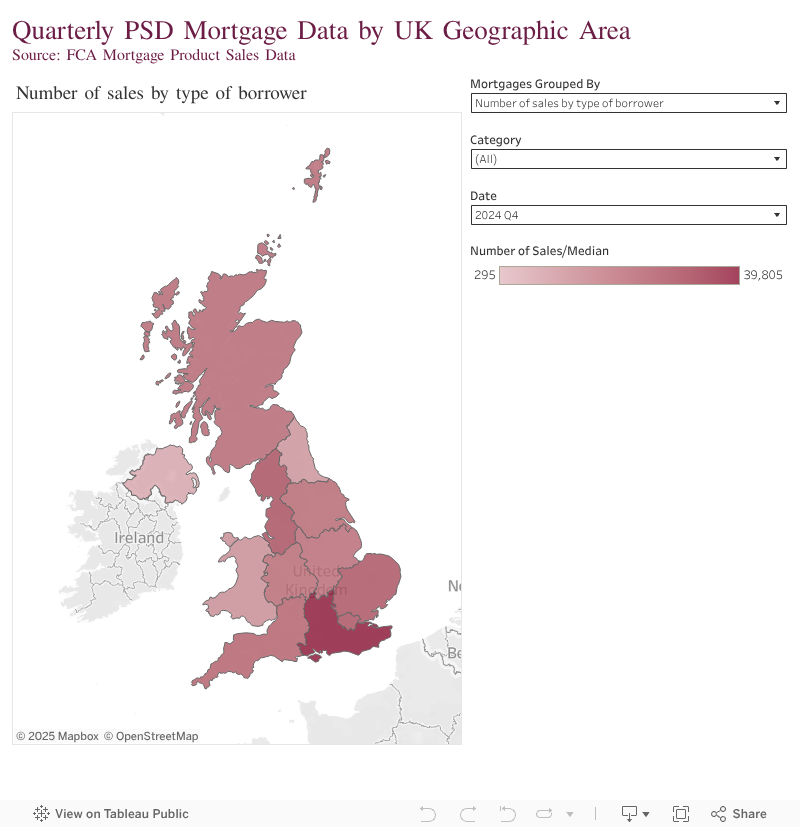
View Quarterly PSD Mortgage data maps by UK geographic area in Tableau