This page gives a breakdown of pure protection product sales data (PSD) from 1 January 2020 to 31 December 2024.
We breakdown number of sales by pure protection product types, followed by a granular breakdown of sales by channel and advice given.
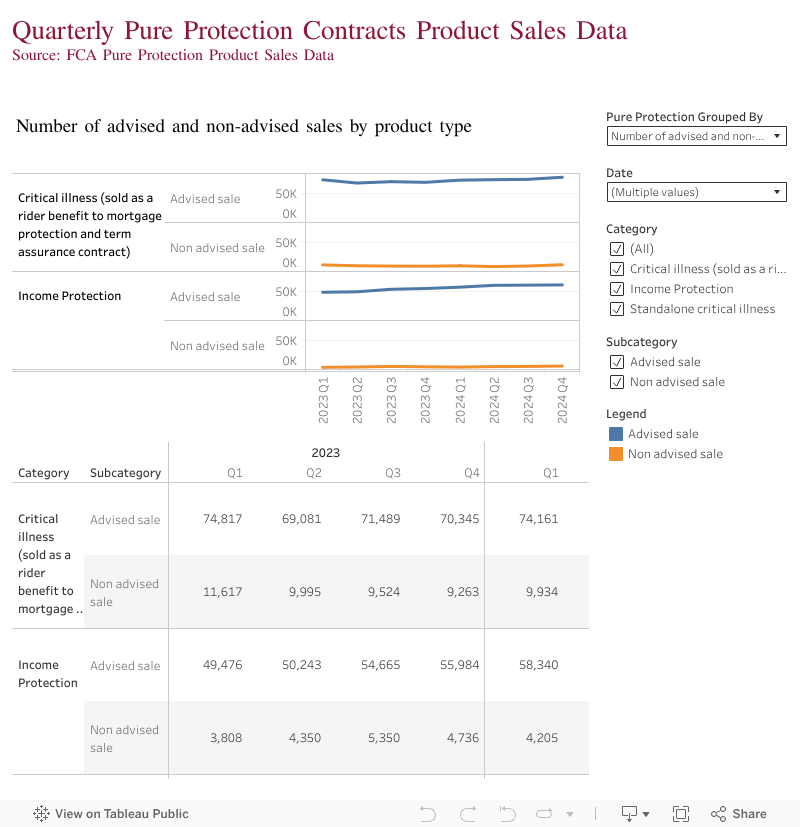
The interactive charts below present a selection of findings from the pure protection contracts PSD set.
How to use the interactive charts
To use the charts, there are 4 filters to choose from:
- Pure protection grouped by – use this to view the pure protection contracts data split by a mix of characteristics and product types
- Date – use this to select one or more time periods
- Category – this allows you to select one or more product types
- Subcategory – when available, this allows you to drill down into the groupings
Chart tip: Remember to clear any ‘Category’ or ‘Subcategory’ filters when you change the ‘Pure Protection grouped by’ filter
The data is correct as of 4 July 2025. Due to a combination of data resubmissions and adjustments, the data is not comparable to data within previous PSD publications.
Download the underlying data for the Tableau dashboard (XLSX)
Quarterly Pure Protection Contracts PSD dashboard
View the Quarterly Pure Protection Contracts PSD dashboard in Tableau
: System update No content change