Circuit breakers play an important role in UK equity markets. During abnormally volatile conditions, they can halt trading in a way that gives the market a cool-down period and pools available liquidity in an auction.
We analyse a sample of events where a sudden, sharp decrease in the price of a security triggers a circuit breaker on the London Stock Exchange (LSE). These events could sometimes, but not always, be referred to as ‘flash crashes’. We use consolidated order-book and trade data from the major UK equity trading venues and their associated dark pools to assess general trading activity and the behaviour of different groups of market participants during the events.
In the period immediately prior to the triggering of the circuit breaker, trading volumes rise and volatility increases significantly. We find that in the five-minute period after a circuit breaker is triggered and the LSE conducts a call auction, trading largely dries up on other UK trading venues and is effectively suspended on dark pools, with subdued quoted depth and wide effective spreads. This suggests that, for the most part, trading and price formation do not shift to these venues when continuous trading on the LSE is not available. High trading volumes are then executed in the LSE’s call auction and, in the period after the trading halt, there is a relatively fast reversion to equilibrium levels of quoted depth, effective spreads and general trading activity across all markets.
Our analysis further indicates that, in aggregate, high-frequency trading firms effectively ‘lean against the wind’ during these episodes of high price volatility. They buy on Lit markets during the price fall and during the recovery, potentially acting as a stabilising force. In contrast, large investment banks contribute the most to the price fall by selling heavily during the decline (although some of their trading may be on behalf1 of other HFT firms). This underscores the nuances and complexity in the debate around whether high frequency trading activity is beneficial or detrimental to markets in times of stress.
In this article, we first explain how circuit breakers work, and summarise the methodology we used to select the events. We then set out our assessment of how market quality changes before, during and after the triggering of a circuit breaker, and how different groups of market participants behave during these events.
Background: how circuit breakers work
Markets that operate with a central limit order book can be susceptible to large price swings that may create execution uncertainty, severe order imbalances and price-contingent orders which become stale. Therefore trading venue operators often employ various mechanisms in an attempt to manage extreme volatility and preserve orderly trading conditions. Circuit breakers are one such mechanism that halts or constrains trading on limit order books in a way that allows a cool-down period and an auction to pool liquidity and dampen volatility.
Individual trading venues generally set their own thresholds for when trading halt mechanisms are triggered, depending on the unique characteristics of their market. For example, the LSE employs circuit breaker thresholds which are triggered when the price of a security crosses either a dynamic or static threshold, leading to a trading halt of automatic executions until a call auction process is completed. Both static and dynamic thresholds are calibrated on a per instrument basis, according to the liquidity of each instrument. The dynamic threshold for FTSE100 shares is breached when a potential order book trade price is more than 3% away from the last executed order book trade price. The static threshold for FTSE100 shares is breached when a potential order book trade price is more than 8% away from the price established in the last auction (e.g. the opening price).
When a potential matching trade price exceeds either of these thresholds, a circuit breaker is triggered and trading is halted for a period of 5 minutes within which no crossing trades may be executed. During this period, a call auction takes place at the end of which matched crossing trades are executed, trading resumes, and the static threshold is reset.
In the dark pools2, trading is effectively unavailable during the 5-minute auction period because the LSE price is no longer contributing to the reference prices used3.
Data analysis
To carry out our analysis we used proprietary FCA data comprising consolidated order-book and trade data from the major UK equity trading venues – the LSE, Turquoise (majority owned by the LSE) and BATS Europe (which operates both the BATS and Chi-X order books) – as well as their associated dark pools. In our analysis we group together the trading activity on the lit order books of BATS, Chi-X and Turquoise as trading that occurs on MTFs, or multilateral trading facilities.
From January 2014 to June 2015, there were 20,349 instances of circuit breakers being triggered on the LSE across all securities traded on the exchange. We restricted our analysis to FTSE350 shares only, for which circuit breakers were triggered 397 times. We set out to explore instances where trading conditions appeared abnormal or stressed. We set aside those triggered shortly before or after the opening or closing auctions as these events are typically more closely associated with the fundamental price-discovery process. We also excluded circuit breakers triggered by news events (e.g. when securities had numerous circuit breakers triggered on a single day due to stock-specific factors). Finally, primarily to simplify the data aggregation process, we focused our analysis on circuit breakers triggered due to a price decrease (e.g. a crash rather than a rally) and excluded those events due to a price increase. In total, our sample of events comprised 51 incidents of circuit breakers triggered on the LSE in FTSE350 securities between January 2014 and June 2015.
While no two events were the same, there were some general patterns as to how the price decline took place before a circuit breaker was triggered. Sometimes the price decline occurred following one or more orders or trades that were very large, relative to liquidity conditions at the time. Other times, there was a somewhat sequential, orderly price fall with no obvious trigger. A few events featured very fast price swings with significant gaps between price levels, in total lasting no more than a few seconds, which could be considered flash-crash-like events. Most events lasted several minutes or longer, however.
Market quality: volatility, effective spreads and quoted depth
We first assessed how market quality is affected in the 60 minutes before, during and 60 minutes after each event.
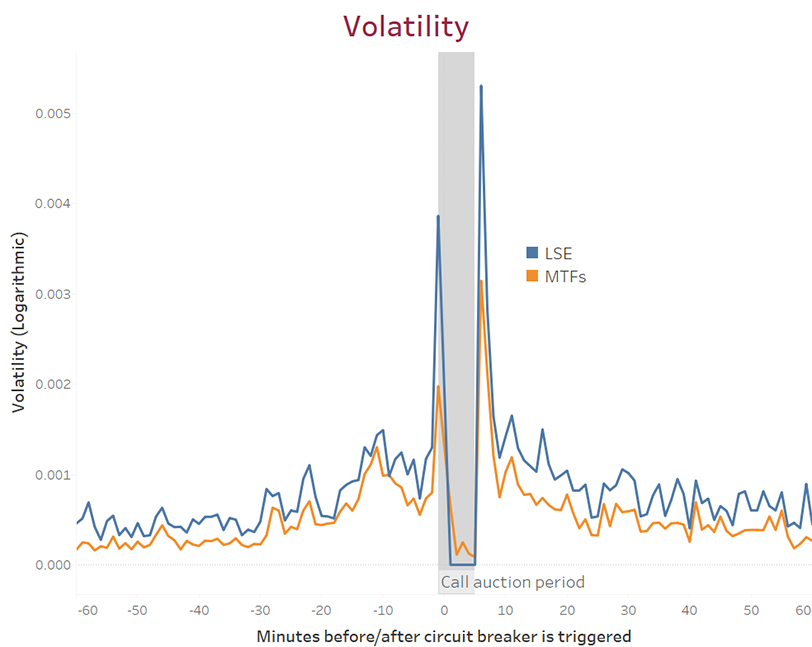
Volatility
Average price volatility4 on the LSE quickly increases just before the trading halt is triggered as the price of each security falls significantly. There is also a spike in price volatility in the minute after continuous trading resumes following the call auction, as traders re-establish the new equilibrium price. Notably, price volatility is very low on the MTFs during the LSE call auction period, reflecting low trading volumes and indicating an absence of abnormal price movements on MTFs (where trading is allowed to continue during the call auction on the LSE).
Effective spreads
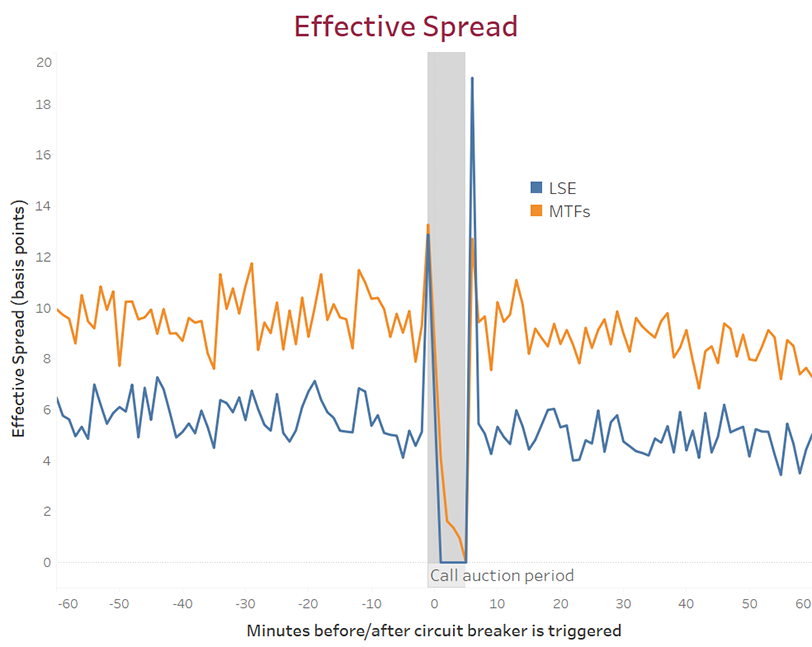
Effective spreads (a measure of the price relative to the mid-quote when a trade is executed) were calculated for each minute period5 across the sample to measure the impact of the circuit breakers on trading costs. We found that, as could be expected during a period of extreme price volatility, the effective spread begins to widen in the minute(s) before the circuit breaker is triggered. It also widens significantly immediately after the call auction is completed and the new equilibrium price is established. However, the effective spread then very quickly returns to ‘normal’ levels.
Quoted depth
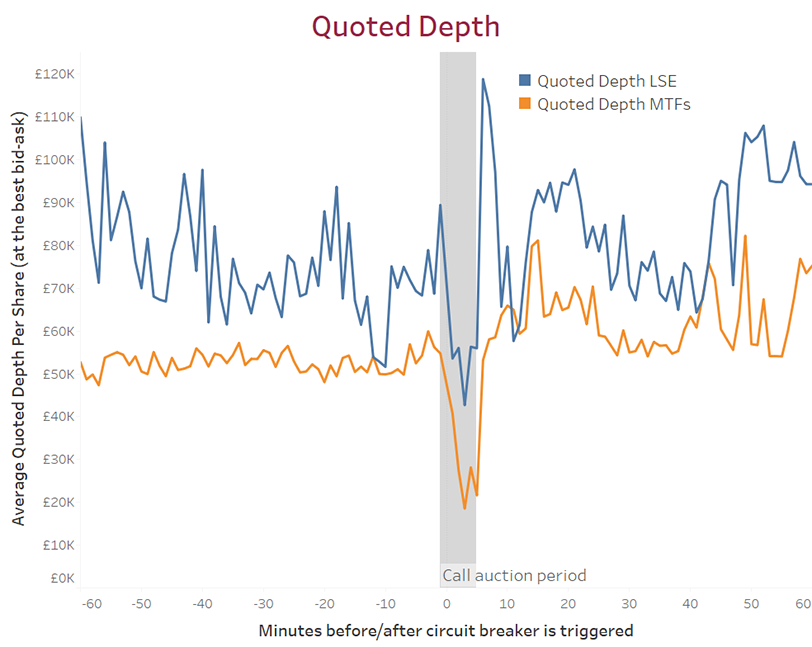
We measured quoted depth (in this case, the total value per share on average available for purchase or sale at the quoted best bid and offer, calculated on a one-minute basis6). Quoted depth decreases during the call auction but rises sharply immediately after continuous trading restarts as traders return to the market. Notably, quoted depth on MTFs appears to be higher on average in the hour after the volatility event compared with the hour before, perhaps to meet additional trading demand.
The trading behaviour of different market participants
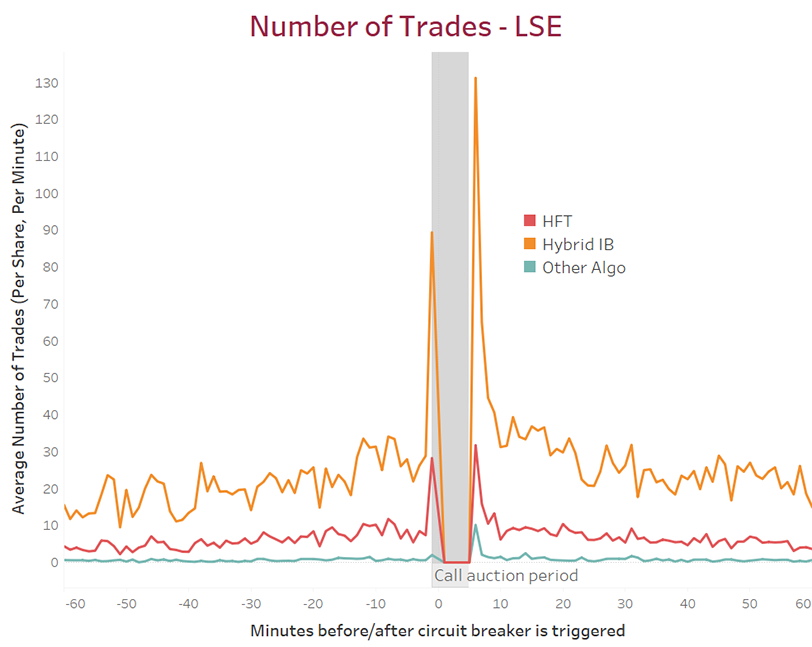
We looked at the trading behaviour of different types of market participants during the circuit breaker events. This allows us to identify the principal actors involved and the directionality of their trading. We grouped firms into three types of trading firms – ‘HFT’, ‘Hybrid IB’ and ‘Other Algo’ firms. HFTs are defined as those firms that solely conduct low-latency proprietary trading. Hybrid Investment Banks, or IB, firms include most large investment banks and some other firms that may use similar technology to HFTs while providing agency trading services or direct electronic access (DEA) to HFTs. Other Algo firms are a subset of small proprietary trading firms that do not meet the activity thresholds designated for HFTs. We excluded ‘slow’ traders – i.e. those that do not utilise specialist low-latency trading technology – as they did not trade in any significant volume during the events.
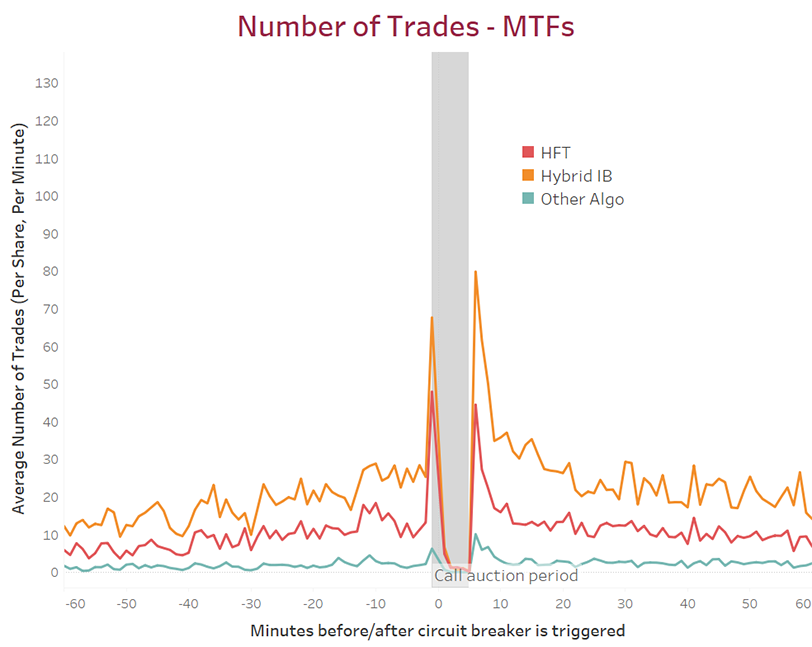
As shown in the charts below, we found that for both HFTs and Hybrid IB firms, the number of transactions increases significantly shortly before the circuit breaker is triggered. During the LSE call auction period, trading on MTF venues tends to dry up and is mostly limited to HFTs trading in low volume on Chi-X. Hybrid IB firms tend to wait until they can transact in large volumes in the LSE auction and immediately thereafter when continuous trading resumes. HFTs participate in the auctions in relatively low volumes and when continuous trading resumes, their trading patterns normalise.
Trading behaviour in Lit markets
We analysed the behaviour of firms by measuring how their inventory levels change. We study these trading behaviours independently in both Lit and Dark markets, before aggregating traders’ cross-market positions.
On Lit markets, the data broadly indicate that HFT traders start with a large short position. As shown later on, this position is mostly offset by a large long position acquired in dark pools. However, in the half-hour period leading up to the triggering of the circuit breaker, HFT traders are collectively buying as the price drastically declines such that their short position reduces almost to zero right before the circuit breaker is triggered. In other words, they are net buyers during the price fall. Conversely, Hybrid IB firms are selling prior to the halt (reducing the size of their net long position). Often, this activity relates to one or more Hybrid IBs executing a large market order or a large quantity of limit orders.
The call auctions executed on the LSE provide the market with a mechanism to pool liquidity – and enable traders to move in and out of positions quickly. After trading restarts, HFTs and Other Algo firms continue buying shares in order to meet selling pressure from Hybrid IBs. Hybrid IBs continue selling well after trading restarts. Overall, this indicates that HFT firms are effectively ‘leaning against the wind’ on Lit markets throughout this period of high volatility, potentially dampening the price swings.
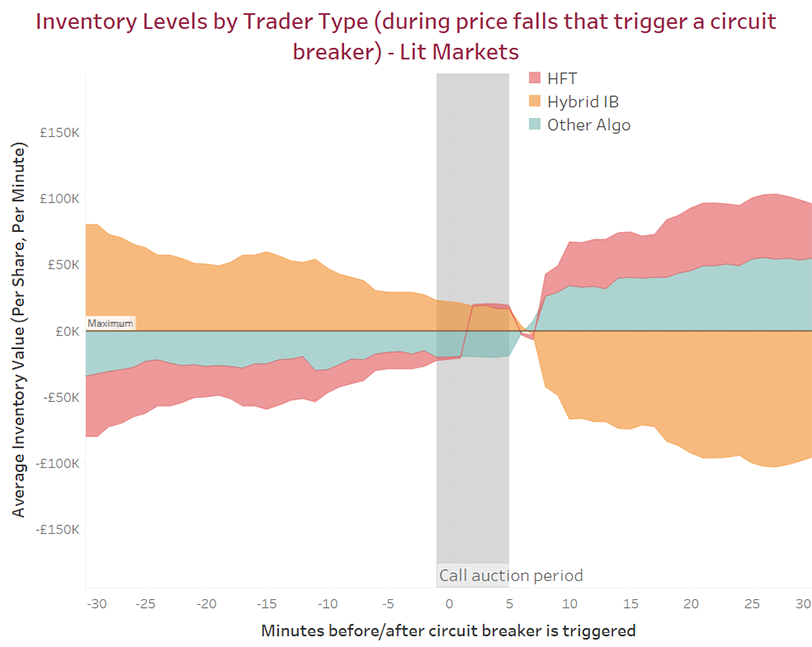
The above chart shows the net inventories of each participant group (the wider the coloured area, the larger the net inventory position). This shows how HFTs buy in Lit Markets as the price of each share falls before a circuit breaker is triggered. In contrast, Hybrid IBs are significant sellers. When trading restarts, HFTs and Other Algo firms remain net buyers while Hybrid IBs continue to sell.
Trading behaviour in dark pools
Hybrid IB and HFT firms’ trading strategies on dark pools are different to those executed on Lit markets. Compared with volumes on lit markets, there is very little dark trading during the events we analyse. Firms are not able to consistently and quickly execute trades in the dark at all times. Furthermore, not all HFT and Hybrid IB firms will trade in the dark, and some stocks see significantly less dark trading than others. It is therefore difficult to aggregate the behaviour across the 51 events and come up with representative dark trading strategies.
Nevertheless, across the entire event window (i.e. both the 60 minutes before and after), 49 of 51 events featured at least some dark trading7. We find that in any one minute period for a given stock, there is very little to no trading. The average number of dark trades per minute across the entire event window was roughly two trades per minute per stock, while the median was zero; it is only when you add up all the trading across 120 minutes and across events, that there is a material amount of trading in aggregate. There also does not appear to be a major spike in dark trading in the minutes leading up to the triggering of the circuit breaker. In other words, firms may not be able to systematically access dark liquidity during price crashes. And during the five minute auction period once the LSE circuit breaker is triggered, trading in dark pools is effectively suspended because the LSE price is no longer contributing to the reference prices used.
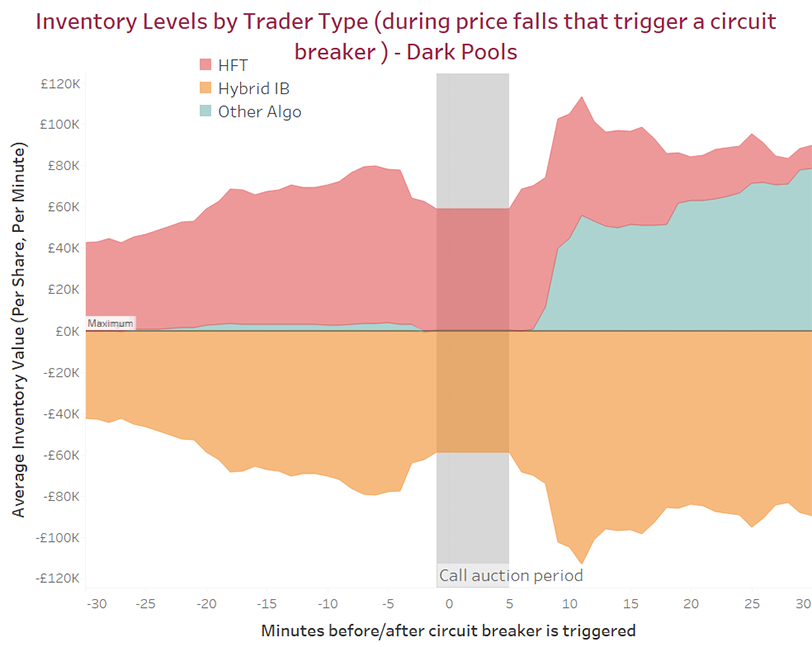
HFTs start with a significant net long position in aggregate as they appear to be net buyers in dark pools in the hour before the volatility events (in contrast to having a net short position on Lit markets). The rationale underlying this trading strategy is that because traded prices in dark pools occur at the mid-point of the bid-ask spread, HFTs can transact at the mid-point in the dark pools while simultaneously transacting at the bid or ask price on the Lit markets, profiting from the difference in the spread.
On average, there is a small amount of selling by HFTs in dark pools in the few minutes before the circuit breaker is triggered, but this is not consistent across all events. In contrast, Hybrid IBs do a small amount of buying in the dark. Liquidity in the dark pools is nevertheless relatively scarce; not much volume is executed during the most extreme part of the price fall in the few minutes before the circuit breaker is triggered.
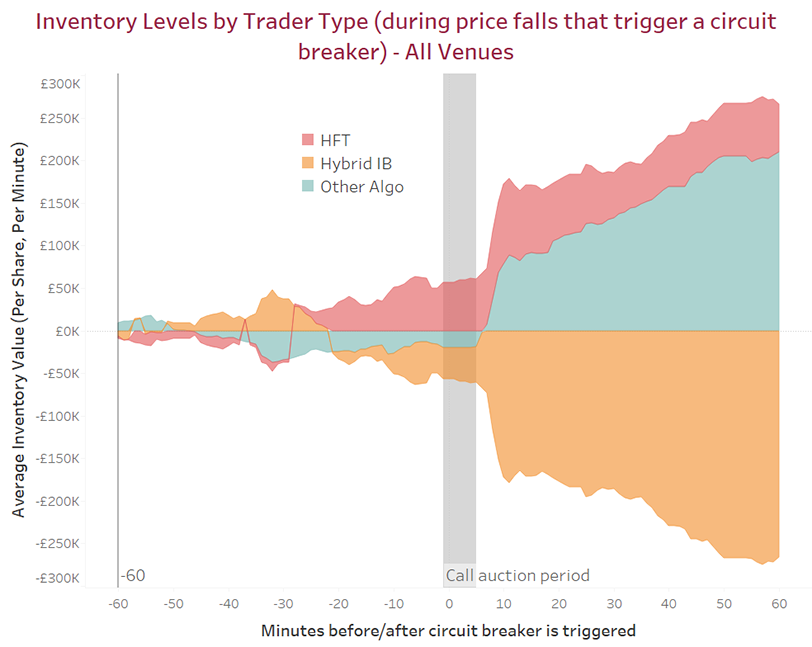
Combining their positions across both Lit and Dark venues, HFTs are on average net buyers during the price fall. Along with Other Algo firms, HFTs then continue to buy strongly after trading restarts. Hybrid IBs, in aggregate, trade in the opposite direction; namely, they sell during the price fall and continue to sell in large quantities when trading resumes after the auction.
Conclusion
In summary, we find that market quality (as proxied by quoted depth and effective spreads) across all UK venues deteriorates just before and during trading halts.
Trading volumes on MTF venues dry up significantly in the five minute period when the LSE conducts a call auction. This demonstrates that volatility and liquidity do not shift to alternative venues when continuous trading on the LSE is unavailable. (A form of trading on LSE is nevertheless available through participation in the auction as part of the price discovery process.) One potential explanation is that investors are reluctant to trade when the primary market with significant market share of trading is absent as a liquidity pool and a reference price. It makes little sense to trade elsewhere while the price discovery process in the auction is ongoing. Trading stops entirely on dark pools during this time as the LSE price is no longer contributing as a reference price, with execution effectively suspended.
Large trading volumes are executed in the LSE’s call auction, and when continuous trading resumes on the LSE, there is a significant spike in trading activity that appears to be largely driven by HFTs meeting demand from Hybrid traders.
Collectively, HFTs effectively ‘lean against the wind’ during these abnormal volatility events, by buying on Lit markets during the price fall and continuing to buy during the recovery. In contrast, Hybrid Investment Banks tend to be substantial sellers during the price fall and after the circuit breaker is triggered. While not all HFT firms trade in the dark, some HFT firms’ trading strategies partly depend on their ability to offset risk by transacting in dark pools at the mid-price and at the bid or ask on Lit markets, profiting from the difference in the spread (although dark trading is relatively scarce overall
These findings can help inform regulators when considering the role played by trading halts as mechanisms to ‘cool down’ trading during episodes of volatility; the potential benefits and costs of high frequency trading activity in various markets; and the utility of dark pools during ‘normal’ times as well as periods of stress.
Footnotes
- Such trading arrangements typically include direct market access (DMA) or sponsored access (SA), whereby an investment firm provides the facility for clients to electronically execute transactions directly on specified trading venues.
- Dark pools are trading venues with no-pre trade transparency where the price and volume of all orders are hidden and anonymous. Trades are matched using a reference price system. Typically, the reference price for orders crossed within a dark pool is based on the best bid and offer on the primary exchange, known as the Primary Best Bid and Offer (PBBO) (i.e. for shares in the UK, this is the London Stock Exchange). Alternatively, operators may include reference prices from other lit venues to calculate the best bid and offer prices with this typically labelled as the European Best Bid and Offer (EBBO).
- When a circuit breaker is triggered on the LSE, automatic execution of orders is halted and there is no corresponding reference price from the LSE available.
- Calculated on a one-minute logarithmic basis (i.e. the log of the maximum price in a given minute divided by the minimum price in the same period).
- We calculated the average effective spread as a simple average for each minute, using the mean for all 51 stocks.
- To calculate the average, we used the mean across all 51 stock events on a per-minute basis. We conducted additional robustness checks by comparing the mean against the median, min and max values, with the median values showing very similar trends. However, we did not standardise before averaging, which is a potential limitation given the variability in the liquidity profile of FTSE350 shares. We found five of the events had significantly higher values than the others, but they did not unduly skew the results according to the median analysis.
- The average number of dark trades per event was 220 across the 120-minute period. The median was 87, the maximum was 1,619 and the minimum was zero.