We publish details of the complaints received by banks, insurers, lenders and other firms, and what those complaints were about. See the latest data and the most complained about firms and financial products.
Financial firms provide us with data every six months about the complaints they have received, what these were about and how they have dealt with them. The firms also have to publish this information themselves when they receive 500 or more complaints within the latest six month reporting period. Smaller consumer credit firms must publish this information when they receive 1,000 or more complaints over the latest yearly reporting period.
Making a complaint to a financial services firm is a free and straightforward process that you can do yourself. Find out more about how to complain.
Complaints from January to June 2016
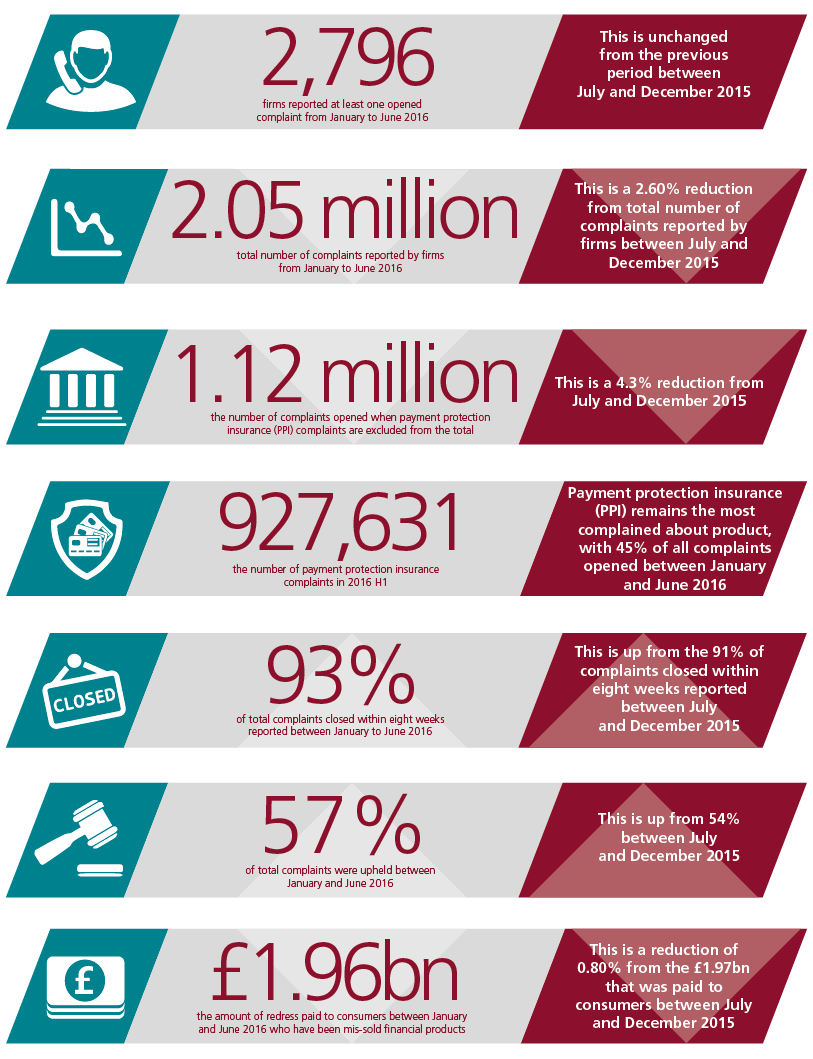
Consumers made a total of 2.05 million complaints to firms in the first half of 2016. This is 2.6% less than the number of complaints made in the previous six months.
Payment protection insurance (PPI) is the most complained about product, but the total number of new PPI complaints was more or less unchanged at 0.93 million. When PPI complaints are excluded, the number of complaints is reduced to 1.12 million.
Complaints about current accounts have seen the largest reduction – 46,000 or 10% - in this period.
Most complained about firms
We use the data that firms provide us to show you how many complaints each one has received, where it was 500 complaints or more in the reporting period. We also show details of how many complaints were closed, how many of these were upheld and how quickly they were dealt with.
You can find out how many complaints a firm received or see the table below for the firms that received the most complaints in the first half of 2016.
| Firm name | No. of complaints | % change* |
|---|---|---|
Barclays Bank Plc | 287,463 | 3% |
Lloyds Bank Plc | 213,163 | -7% |
Bank of Scotland Plc | 173,646 | -5% |
HSBC Bank Plc | 124,891 | 3% |
National Westminster Bank Plc | 121,197 | -10% |
*Change between July to December 2015 and January to June 2016.
Most complained about products
We also publish data that shows the total number of complaints about different product groups, types of firms and the reason for the complaint.
You can see the number of complaints according to product type and the reason behind the complaints. The table below shows the most complained about financial products.
| Financial product | No. of complaints opened | % change * |
|---|---|---|
| Payment protection insurance | 927,631 | -0.5% |
| Current accounts | 407,954 | -10% |
| Other general insurance | 300,903 | 1% |
| Credit cards | 129,770 | -1% |
| Savings (inc Cash ISAs) and other banking | 73,322 | 7% |
*Change between July to December 2015 and January to June 2016.
More on the complaints data
Prior to 29 June 2016, we did not require firms to submit complaints data for complaints that were resolved by the end of the following business day after they were received. This rule is set out in our Handbook at DISP 1.5. From 30 June 2016 the rule changed so that all complaints become reportable and this new data will feed into the next complaints data publication due in April 2017. The amendments to DISP 1.5 were discussed in Policy Statement 15/19.
Find out more about the complaints data that firms provide to us.
Although we do not currently publish the number of complaints by number of customers or number of accounts - to put their figures into context in relation to the size of their business - we recommend that firms do so on their own websites. Our downloadable table provides a link to each firm’s website where you can find this additional information.