With MiFID II altering the landscape of equity markets, we take a look at this emerging trading format – with the help of data.
The second Markets in Financial Instruments Directive (MiFID II) is designed to enhance market transparency and orderliness. Features such as the double volume cap (DVC), which restricts dark trading above specified thresholds) and the trading obligation aim to improve price formation by encouraging more transparent, multilateral trading.
Since MiFID II entered into force on 3 January 2018, we have seen a rise in the use of ‘periodic auctions’ as a method for share trading. It has been suggested that this is explained by trading that was previously ‘dark’ and is prohibited under MiFID II once certain thresholds are met, migrating to this method.
Our analysis of the data on periodic auctions shows that:
- periodic auction activity counts for a very small but rising share of the overall equity trading market
- there is little difference in the growth in auction volume in shares where dark trading has been suspended under the DVC in comparison with shares for which dark trading is still allowed
What is a periodic auction?
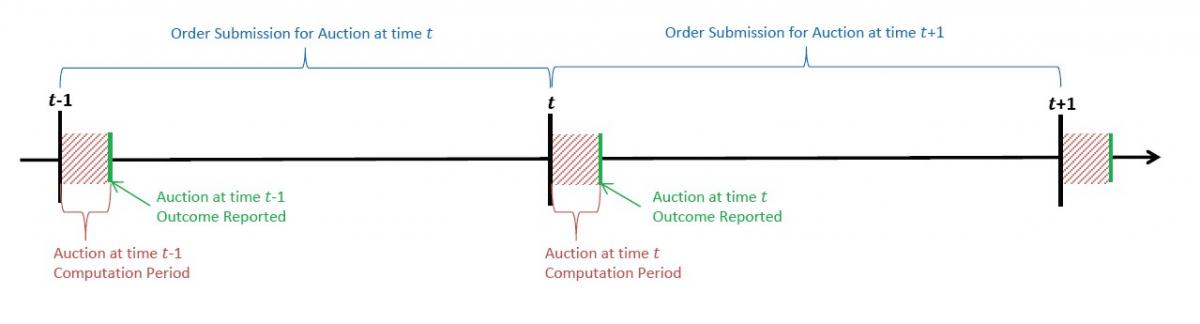
This is similar to a conventional auction. The operator collects offers to sell shares at or above a minimum price and buy at or below a maximum price specified by the selling or buying firm respectively. The auction platform then determines a single ‘uncrossing’ price which maximises the amount of business which can be executed at the same uncrossing price.
A variety of models exists. One common approach is to collect trading interest throughout the day, and to trigger a ‘call period’ every time that a pair of opposing orders can be matched (ie there is an order to buy and an order to sell, where the selling price is not higher than the buying price). During the call period, usually a fraction of a second, the operator distributes information about the indicative uncrossing price and the amount of shares expected to be executed. Other participants can then decide to submit their own buy and sell orders into the auction.
The key difference between periodic auctions and central limit order books (CLOBs), which is the most common format for share trading, is that CLOBs are continuous. If a trading firm sends a buy order to a CLOB and there is a matching sell order resting on the order book, the trade will execute instantly in accordance with the time at which the order is received. In a periodic auction, the firm has to wait until the end of the call period. However, given the speed of modern share trading that wait maybe only 100 milliseconds.
Figure 1: Process flow for periodic auctions. Source: Budish, Cramton & Shim (2013)
MiFID II and periodic auctions
One of the high-profile features in MiFID II is the ‘double volume cap’ (DVC). The DVC aims to limit dark trading in shares. Trading is ‘dark’ when the price and quantity to be traded is not disclosed to the market before execution. Under the DVC, dark trading in a given share is suspended[1] (with exemptions for large trades) for six months if:
- it exceeds 8% of total trading, or
- on any one trading venue it exceeds 4% of total trading
The DVC was first applied on 12 March 2018, and there are currently 91 shares from the FTSE100 for which dark trading is suspended, and 180 shares from the FTSE250[2]. It has been suggested that the rising popularity of periodic auctions is driven largely by the DVC. Periodic auctions are not a form of dark trading. Public information is provided about buying and selling interest during the auction call periods according to MiFID II rules. But, while CLOB trading requires detailed disclosure of buying and selling interest at every price level, periodic auction operators are required only to disclose indicative uncrossing price and volume for the auction. Table 1 below provides a summary of the key characteristics of each trading format.
Table 1: Comparison of trading formats
| Dark | Systematic internaliser (SI) | Auction | CLOB | |
|---|---|---|---|---|
| Pre-trade transparency | None | Bid and offer prices up to standard market size[3] | Indicative uncrossing price and quantity executable at that price | Aggregate number of orders and volume for at least the first 5 price levels[4] |
| Trading permitted on capped equities | No[5] | Yes | Yes | Yes |
| Multilateral | Yes | No | Yes | Yes |
| Implications for trading firms | Avoids pre-trade disclosure of trading interest | Provides executable and transparent quotes up to certain sizes | Allows liquidity aggregation and greater price protection while reducing speed advantage | Ensures full pre-trade transparency and immediacy |
It is possible that a lower level of pre-trade transparency is more attractive to market participants who are concerned about market impact and previously traded in the dark but have been forced to change their trading patterns by the DVC. However, if this was solely the case, we would expect to see the biggest move to periodic auctions happening in shares where dark trading has been banned under the DVC.
Against this background, we looked at how significant the increase in periodic auction trading has been and what might have been driving it.
How much periodic auction activity has there been?
Figure shows trading volumes for FTSE350 shares, on CBOE, which is by far the largest periodic auction venue in the UK accounting for circa 90% of volume activity[6]. Other venues include Goldman Sachs Sigma X, Turquoise, NASDAQ and ITG POSIT.
Figure 2: Daily trade volume, CBOE periodic auctions, FTSE350 equities. Source: FCA, Thomson Reuters Tick History
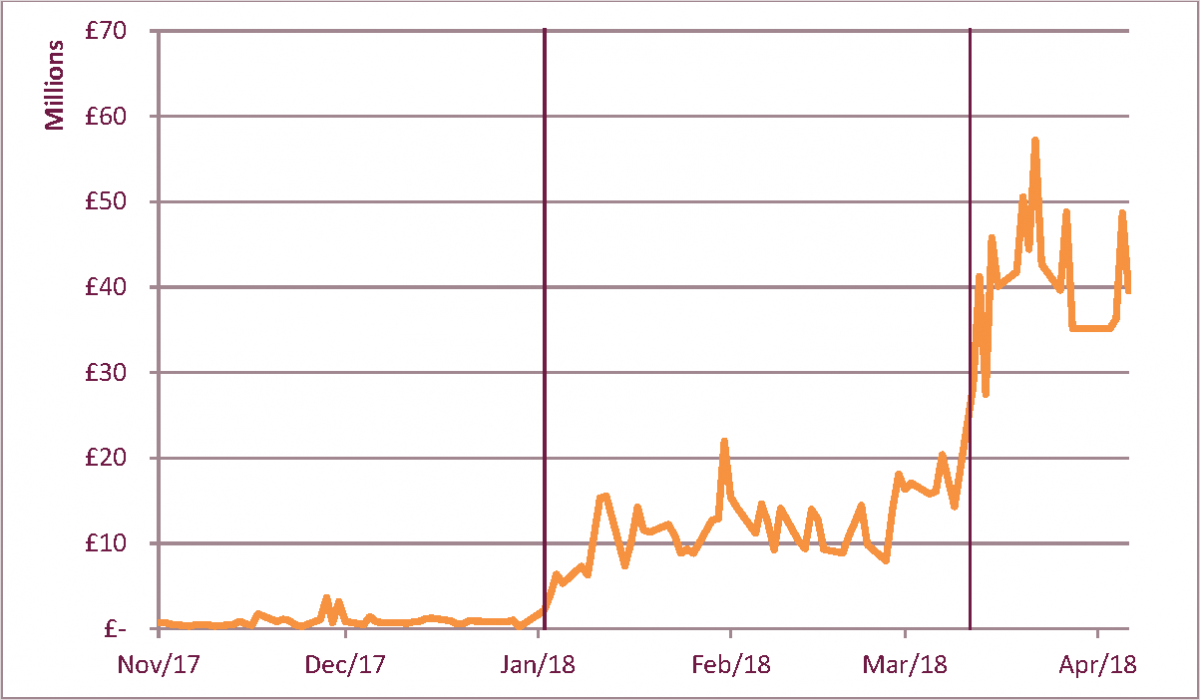
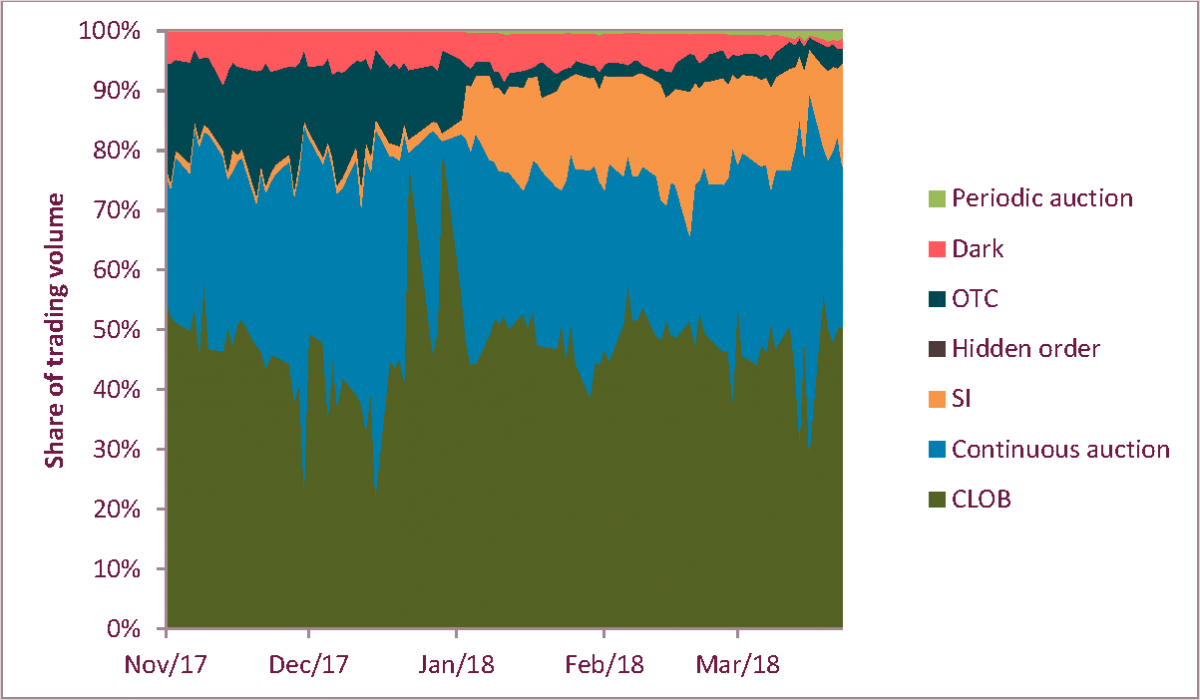
This chart shows the rapid growth of activity on periodic auctions since MiFID II was implemented and the further acceleration after the application of the DVC on 12 March 2018. But, it is important to put the rapid growth of periodic auctions in the context of total trading in shares. Figure 3 below shows trading volumes across the market as a whole. While the increase in periodic auction trading is just about visible, it remains a very small part of the market. At its most prominent it comprised no more than 4% of activity, around one twentieth of the CLOB share and one tenth that of systematic internalisers. This demonstrates that while the rate of growth has been striking, periodic auctions do not yet appear to have become a major part of the trading infrastructure.
Figure 3: Share of equity market attributable to each trading format. Source: FCA, Thomson Reuters Tick History
What is driving this increase?
One way of assessing whether the increased popularity of periodic auctions is driven by the DVC is to compare periodic auction volume between those shares for which dark trading has been banned under the DVC and those for which dark trading is still allowed. Table 2 and Table 3 show how trading volumes in capped and uncapped shares has increased since January 2018 and the implementation of the DVC. If the DVC is driving trading out of the dark and into periodic auctions, we would expect to see a significantly larger increase for the shares subject to dark trading bans.
Table 2: Average daily trade volume for each timeframe and equity type, CBOE periodic auctions, FTSE350 equities. Source: FCA, Thomson Reuters Tick History.
| Before 3 January 2018 Pre-MiFID II | 3 January - 11 March 2018 Pre-DVC | From 12 March 2018 Post-DVC | |
|---|---|---|---|
| Capped | £0.62m | £9.0m | £30.9m |
| Uncapped | £0.28m | £3.2m | £10.1m |
Table 3: Increase in average daily trade volume following each milestone. Source: FCA, Thomson Reuters Tick History
| MiFID II | DVC | |
|---|---|---|
| Capped | 14.8x | 3.4x |
| Uncapped | 11.5x | 3.2x |
As the tables show, there is in fact little difference between the increase in periodic auction volume relative to pre-MiFID II levels for those shares subject to dark trading bans under the DVC compared with shares for which dark trading is still allowed – although starting from a very low base. While we have anecdotal evidence that some market participants are indeed switching from dark trading to periodic auctions in response to the DVC, these data strongly suggest that this is not the whole story.
Other explanations are possible. For example, another benefit of periodic auctions for participants is that they reduce the importance of speed and latency. In a CLOB, if a firm’s order arrives after that of another market participant, even by only one nanosecond, then that other order will be ahead in the queue. This can result in the later trade not being executed, or getting a worse price. In periodic auctions, these tiny time differences matter much less. This means that market participants who do not have access to superfast trading technology (for example servers located in the same building as those of the exchange operator, direct fibre optic or microwave connections between different trading locations) are less at risk of losing out to those who do. This has been used as an argument for replacing the ‘continuous auction’ of the CLOB with periodic auctions[7], to establish a more level playing field between market participants[8]. Another possibility could be the ability to trade at mid-point through peg orders. This is a feature that we are currently analysing.
It is also possible that the growth in periodic auction volumes is in part attributable to activity that had previously been OTC prior to MiFID II entering into force. Indeed, and as shown in Figure 3 above the drop-off in OTC volumes coincides with the initial increase in periodic auction volumes. Furthermore, this trend in periodic auction activity comes at the same time as growth in the proportion of trading executed through SIs. Traders now have the option of trading through periodic auctions or SIs, and might use the SI format were the periodic auction option not available.
Conclusion and implications for regulators
The rising popularity of periodic auctions is an interesting part of the post-MiFID II evolution of share trading. However, this particular trading technique has grown from being tiny to being very small. It is currently far from being a major feature of the overall equity trading landscape. The data we have reviewed do not at first sight support the hypothesis that the growth of periodic auctions has been driven solely by the introduction of the DVC. Growth has been consistent across shares that are capped as well as those that are not.
We are still in the early stages of the MiFID II regime. Market participants continue to adapt to the new environment and infrastructure providers continue to develop new solutions. We note that periodic auction systems currently encompass a range of different methodologies and functionalities[9], and co-exist with a variety of other bilateral and multilateral execution channels. We are therefore carrying out further analysis of the equity trading landscape as a whole, including the design, calibration and use of periodic auctions within it, to understand the market outcomes this is generating and how these align with the policy intentions of MiFID II and the FCA objectives in terms of impact on fair and orderly trading and market transparency. We will publish further analysis of these issues, as appropriate, in light of this work.
Footnotes
- ^ In the sense of the use of waivers granted to trading venues permitting dark trading
- ^ As of 31 March 2018
- ^ Minimum quotation size is 10% of standard market size
- ^ As applicable depending on the liquidity
- ^ Unless for example the system operates only in block sizes
- ^ Source: Rosenblatt Securities Inc.
- ^ The terms ‘frequent batch auction’ and ‘periodic auction’ are interchangeable
- ^ See, for example, Budish, Cramton and Shim 2014 (PDF)
- ^ For example, they may offer ‘broker preferencing’ or ‘broker priority’ functionality, allow orders that peg to mid-point prices, apply different rules to the submission and cancellation of orders and operate different auction uncross models