This page provides an overview of the key findings from the mortgage product sales data (PSD) covering the period between 2014 and 2018. It focuses on the annual mortgage tables split by geographic area.
Download underlying data (XLSX)
Notes: The interactive maps below present a selection of findings from the mortgage product sales data set. To use the maps please select the desired value from the drop down you wish to view. To adjust the geographical area to represent information from different years please adjust the ‘Year’. Some metrics will not show a clear view for ‘All’ as the map is calibrated to view the drilldown details data.
Some geographical areas in the interactive maps vary from the PSD naming convention. Changes are;
| PSD geographical area name | Interactive map geographical name |
|---|---|
| Central & Greater London | London |
| Eastern | East of England |
UK mortgage sales
In 2018, 1.22 million mortgages were sold in the UK, a 5% increase on the 1.16 million mortgages sold in 2017. Figure 1 shows the South West had the highest number of mortgage sales in 2018 (157,661 sales), accounting for 13% of all mortgages sold. The North West saw the largest increase (7%) from 126,993 sales in 2017 to 135,756 in 2018, accounting for 1 in 10 UK mortgages sold. The North West also had the largest increase in sales overall between 2014 and 2018, up 34,786 (34%) from 100,970 to 135,756. For the data in this map please see ‘Table 1.1’ on the ‘Annual Geographic Breakdown’ tab.
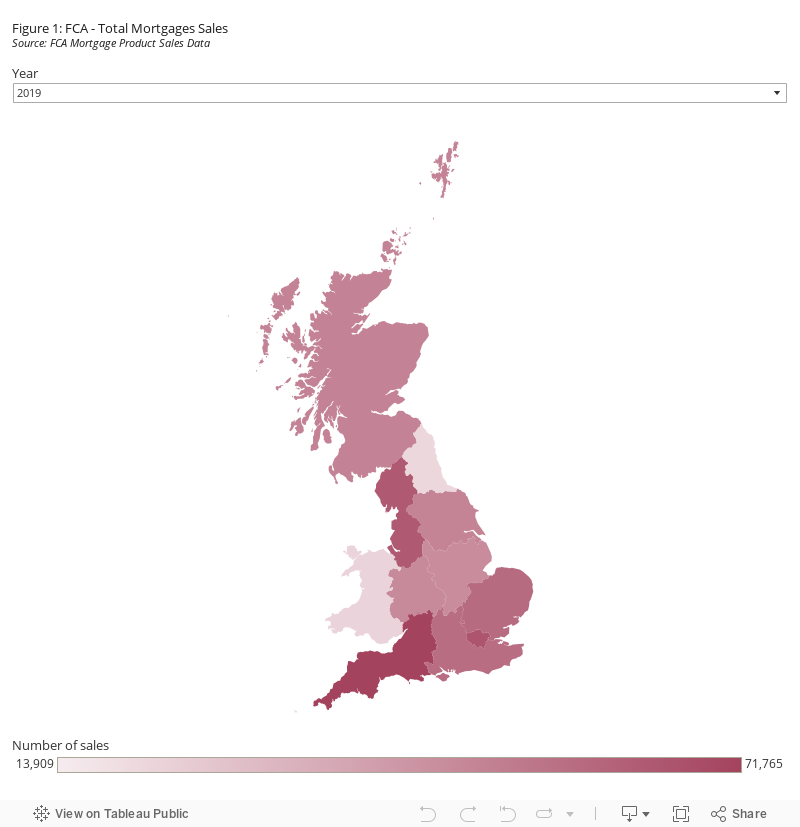
View interactive map: Figure 1- Total mortgages sales on Tableau Public
Sales by loan amount
Loan amounts have increased over time with higher value loans focused in the South, the highest being London. Figure 2 shows sales in the £120,001-£250,000 loan value band, where the North West saw the largest increase in sales (9%) from 51,283 in 2017 to 55,967 in 2018. Between 2014 and 2018, London had the largest decrease (23%), down by 12,762 sales when looking at 2018 (43,809 sales) compared with 2014 (56,571 sales). The South West continued to have the largest concentration of sales in this band, from 2014 to 2018 with sales for 2018 at 82,237. For the data in this map please see ‘Table 3.1’ on the ‘Annual Geographic Breakdown’ tab.
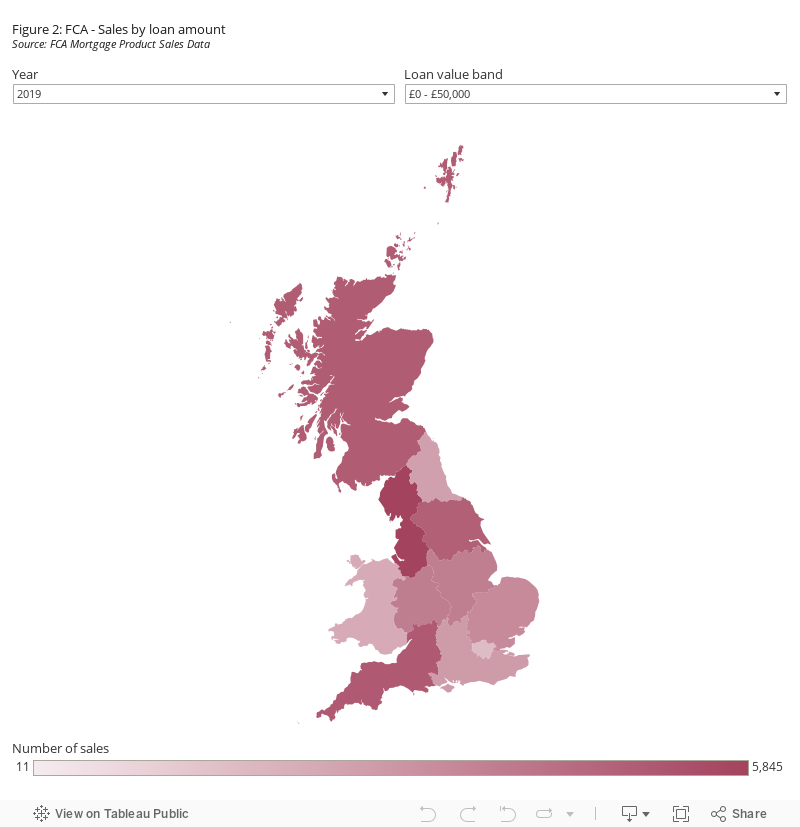
View interactive map: Figure 2 - Mortgages sales by loan value on Tableau Public
Figure 3 shows the median loan values for mortgage sales. London had the highest median loan value in 2018 with £281,000, followed by the South East with £212,000 and East of England with £192,000. East of England had the largest growth in median loan values between 2014 and 2018 (24.5%) from £154,200 in 2014 to £192,000 in 2018. For the data in this map please see ‘Table 3.2’ on the ‘Annual Geographic Breakdown’ tab.
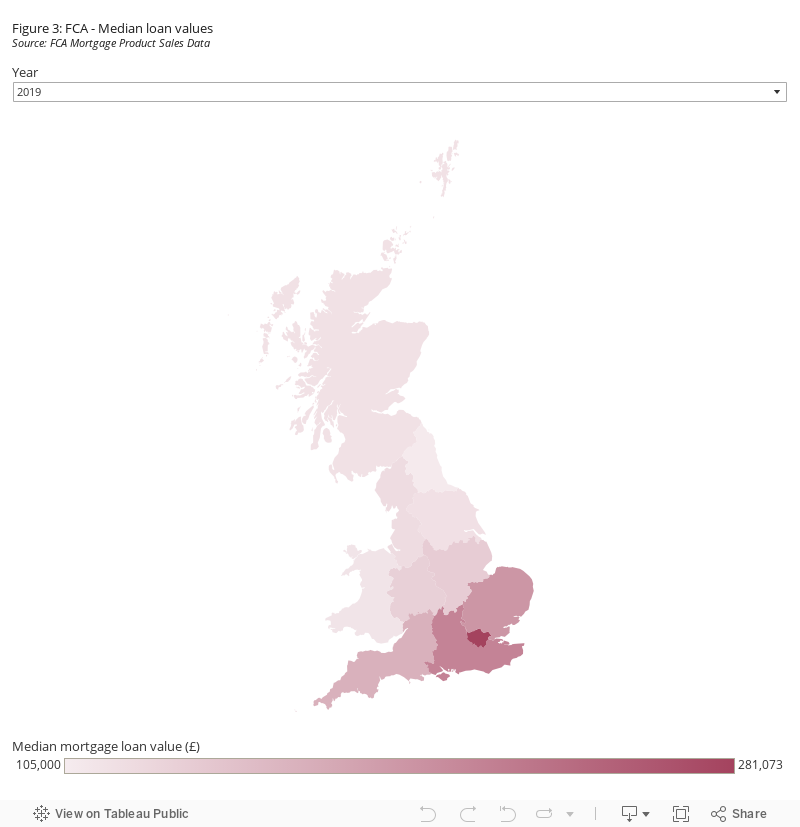
View interactive map: Figure 3-Median loan values
Sales by loan to value (LTV)
Between 2014 and 2018, UK mortgage sales were largely concentrated in the 50 to 75% LTV band. Figure 4 shows the North West had the highest number of sales (12,554) in the 90 to 95% LTV band in 2018. Scotland had the largest increase (6%) in sales requiring lower deposits with LTVs of 90 to 95%, with an increase of 615 from 9,992 in 2017 to 10,607 in 2018. Scotland also had the largest percentage growth between 2014 and 2018 in this band (120%) from 4,817 in 2014 to 10,607 in 2018.
Figure 4 shows the North West had the largest increase in sales in the 85 to 90% band (7%) with an increase of 1,576 sales from 22,312 in 2017 to 23,888 in 2018. For the data in this map please see ‘Table 3.4’ on the ‘Annual Geographic Breakdown’ tab.
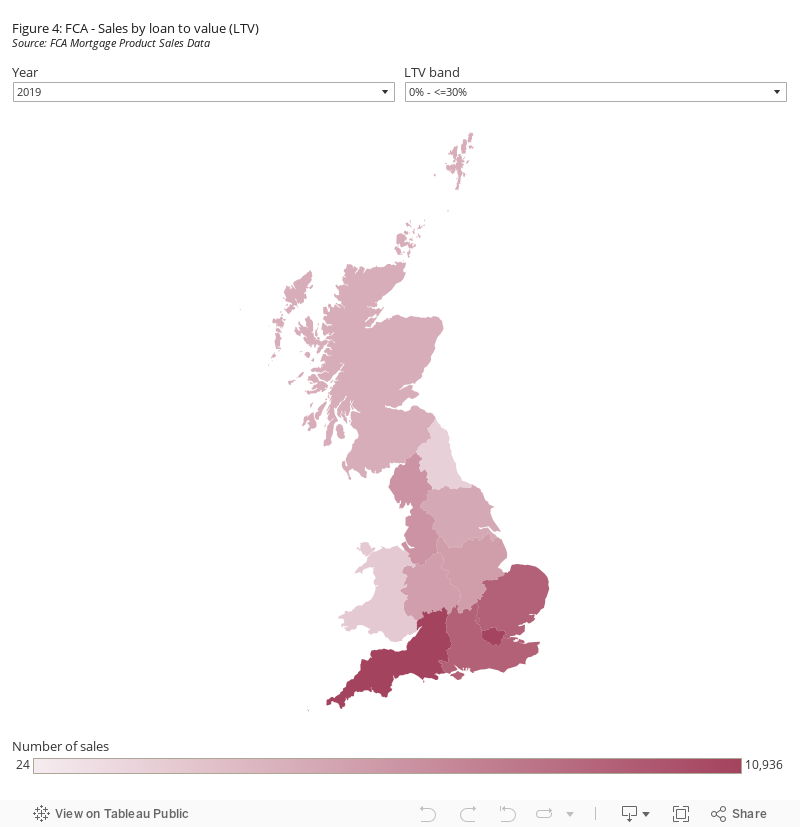
View interactive map: Figure 4 - Mortgage sales by LTV
Figure 5 shows the median UK LTV ratios. Generally, most median LTV ratios were concentrated around the mid 70% range with exceptions in the South. London had the lowest median LTV ratio in 2018 with 59%, which remained relatively unchanged aside from a 6-percentage point decrease from 2014 to 2015. For the data in this map please see ‘Table 3.5’ on the ‘Annual Geographic Breakdown’ tab.
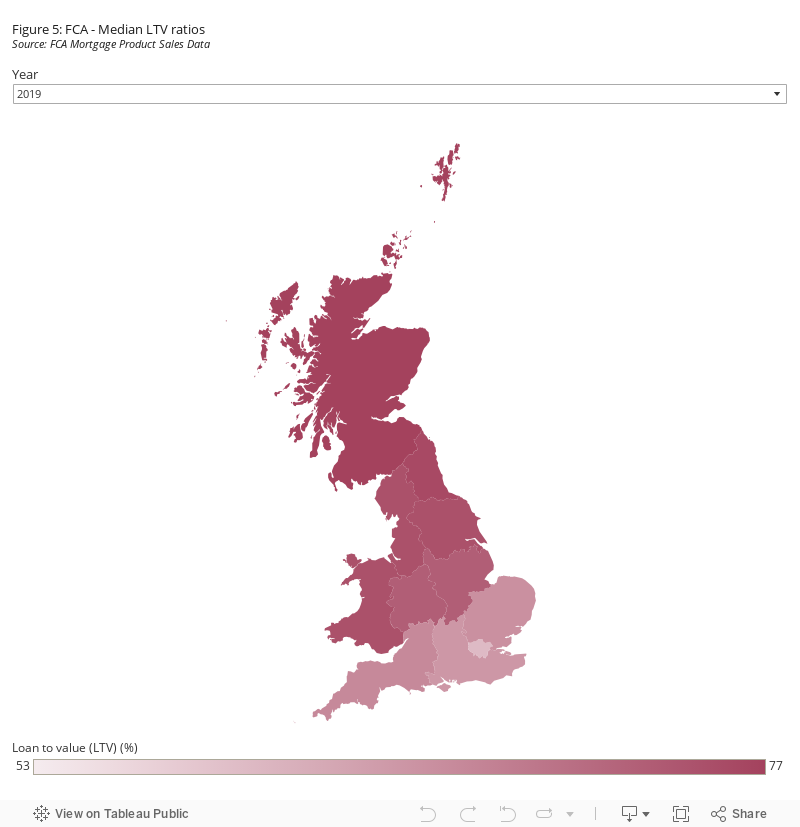
View interactive map: Figure 5 - Median LTV ratios
Sales to borrowers with impaired credit history
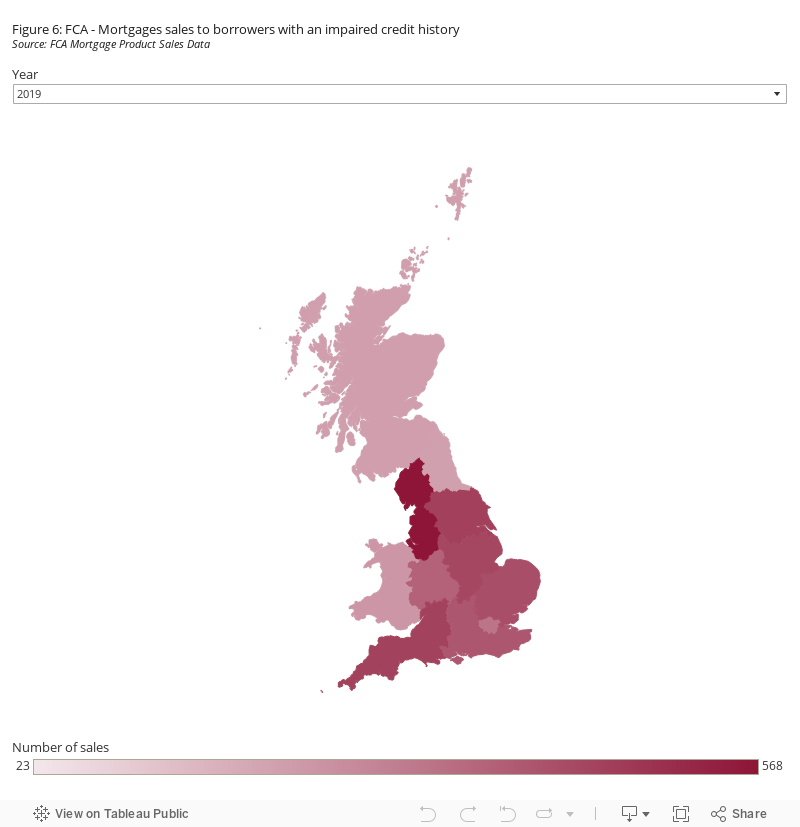
Sales to borrowers with an impaired credit history were comparatively few overall, making up 0.6% of all sales in 2018. However, sales to these borrowers has increased by 195% (4,907 sales) from 2,520 in 2014 to 7,427 in 2018.
Figure 6 shows that the North West had the largest increase (47%) with 731 in 2017 to 1,072 in 2018, compared with 257 in 2014, a 317% increase between 2014 and 2018. For the data in this map please see ‘Table 4.1’ on the ‘Annual Geographic Breakdown’ tab.
View interactive map: Figure 6 - Mortgages sales to borrowers with impaired credit history