In our 2018/19 Annual Report we have published a new measure of market cleanliness – the Abnormal Trading Volume ratio (ATV).
In last year’s Annual Report we committed to develop additional metrics that would help improve our evaluation of market cleanliness.
Developing additional measures of market cleanliness helps us monitor and assess the effectiveness of our regulatory work on market integrity.
We have previously measured market cleanliness using a calculation of the percentage of UK takeover announcements that show abnormal price movements in the 2-day period ahead of those announcements. We have always highlighted the limitations of this measure, for example, its high volatility due to a small sample size.
Market cleanliness should not be gauged by a single metric. It requires numerous measures to reflect potential harm to relevant markets. In future years, we will seek to include additional measures that will further characterise the state of UK markets.
It is equally important that before we publish a metric, that it passes the following tests:
- It is a rigorous and meaningful measure
- It can be clearly explained and communicated
- It is clearly focused on a type of behaviour or asset class
- It can be consistently produced over time to ensure that trending is possible
Additional Metric: the Abnormal Trading Volume ratio
The ATV ratio encompasses over 1,000 events. An event is defined as an unexpected, potentially price-sensitive announcement. It captures products which were not included in the earlier metric, namely CFDs and spread bets where the underlying is a relevant equity. It therefore gives us a more accurate understanding of participant behaviour and market activity.
The additional metric is based on the premise that inside information should be properly controlled. It should only be disclosed to those who need to know it and should not be used to trade ahead of its disclosure to the wider market.
An increase in trading volumes ahead of unexpected, potentially price-sensitive announcements, could be an indicator of an unclean market, even when the share price does not move significantly.
There will be many reasons for trading volume fluctuations which are not suspicious. However, where information is appropriately controlled, we would not expect to see a statistically significant increase in trading volumes ahead of unexpected, potentially price-sensitive announcements.
Methodology
Summary
To detect if there is an abnormal increase in trading volumes we take the period prior to an unexpected potentially price-sensitive announcement (during which there are no other potentially price-sensitive announcements (the Observation Period)). We split the Observation period into two, both defined in the table below:
- the Benchmark Period
- the Announcement Period
The test (once overall market volume changes are accounted for) is a simple statistical test (the Welch Variation of the standard T-Test) measuring if the two periods are significantly different from one another. We selected a 5% significance level.
The new metric is calculated as follows:
Abnormal Trading Volume ratio% = # of Announcements where we reject the null hypothesis*
# of Announcements Tested
*null hypothesis = There is no statistically significant difference between the trading volumes in the Benchmark Period and the Announcement Period.
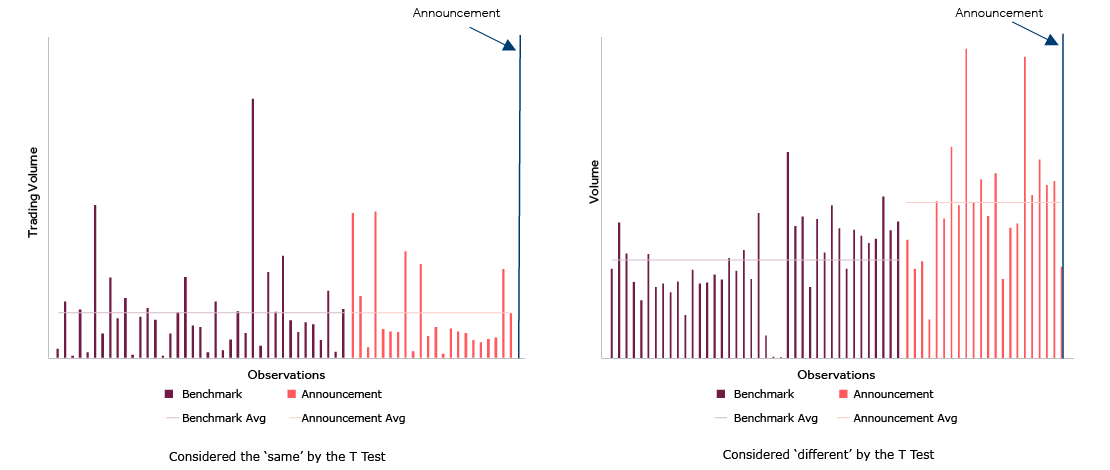
The Welch Test can best be illustrated by comparing two datasets, one where they are considered the ‘same’ and one where there is a ‘difference’. The charts depict the trading volumes for each observation (explained below) in the Benchmark Period and the Announcement Period.
The results
Chart tips: hover over data series to view the data values and filter the data categories by clicking on the legend.
Chart
Data table
| Date | Announcements tested | Announcements that have a statistically significant increase in volume | ATV Ratio |
|---|---|---|---|
| Q1 2018 | 273 | 17 | 6.2% |
| Q2 2018 | 401 | 27 | 6.7% |
| Q3 2018 | 195 | 13 | 6.7% |
| Q4 2018 | 201 | 11 | 5.5% |
We tested trading activity before 1070 announcements and found that for 68 announcements, we can reject the 'null hypothesis' at our significance level. The results of our ATV ratio calculation are below. It should be noted that this trading activity represents a small proportion of the total UK equity market activity during 2018.
This ratio shows that on average during 2018, the proportion of unexpected potentially price-sensitive announcements, preceded by statistically abnormal increases in trading volumes, was 6.4%. It is relatively stable throughout the year, with the lowest period being the 4th quarter, at 5.5%. Statistically significant increases in trading volumes ahead of certain announcements, do not mean that market abuse occurred. Trading volumes can fluctuate for a variety of reasons. However, it is an indicator that market abuse may have occurred. We do not yet have a historical comparison of the new statistic as the calculation uses MiFID II transaction reporting data (introduced only in January 2018).
Design Decisions
The following table details the scope of the metric and the key design elements that have been considered when building it.
We tested where we should set two key variables – the length of time we allow for the Announcement Period and the length of time we allow for the Benchmark Period. We define both periods and set out our analysis of this testing below.
Design Decisions | Decision | Rationale |
|---|---|---|
| The statistical test used | Welch Test (variant of T Test) | Our data contains samples of different sizes, which are likely to have unequal variances, therefore we use the Welch test as it is more reliable under these circumstances. |
| The time periods |
‘Observation Period’ ‘Observation’
‘Announcement Period’ ‘Benchmark Period’ | The period immediately before an unexpected price-sensitive announcement which is split into an Announcement and Benchmark Period that can be assessed, in order to test the null hypothesis. A trading volume data set (obtained during a half day trading window during either the Benchmark Period or the Announcement Period) eligible for inclusion in the ratio – during the Observation Period. The Announcement Period is the period immediately before an unexpected, potentially price-sensitive announcement. The Benchmark Period is our control period, occurring immediately before the Announcement Period. |
| The length of the time periods | Benchmark Period: 20 working days. Announcement Period: 10 working days. | We determined the length of our periods by taking account of the following trade-offs:
Please see the charts below for a comparison and explanation of the results we obtained when testing Benchmark and Announcement Periods of varying lengths. |
| Announcements included | All announcements which we consider the market would not be expecting, which are potentially price sensitive and where no other potentially price-sensitive announcements occurred during the Announcement and/or Benchmark Periods. | For the purposes of the ATV ratio calculation, what we have considered to be ‘potentially price-sensitive’ and ‘unexpected’ has been aligned to the interpretation we use for operational purposes. For example, during our market monitoring activities, we categorise announcements as ‘potentially price-sensitive’ or ‘not potentially price-sensitive’ for example, a takeover announcement would be price-sensitive and a notification of an AGM would not be price-sensitive. The existence of other potentially price-sensitive announcements in any of the periods could harm the reliability of the metric. Where we have identified any other potentially price-sensitive announcements during either the Benchmark or the Announcement Periods, these announcements were removed from the sample. |
| Financial instruments included | All equities that are traded on a market with the operating Market Identifier Code (MIC) ‘XLON’. All CFDs and spread bets that are traded OTC where the underlying is an equity that is traded on a market with the operating ‘XLON’ MIC. | We consider this to be a reasonable representation of the UK equity market because the XLON MIC identifies most of the instruments on the primary UK listing venues. We also include key derivative contracts for those instruments, namely CFDs and spread bets, to capture the broader trading activity in those instruments. |
| Required number of Observations | We only perform the tests when there is a minimum of 20 Observations during the Benchmark Period, and a minimum of 10 Observations during the Announcement Period. | Statistical tests are more reliable with larger sample sizes, deciding on the minimum number of Observations for the test was therefore a trade-off between the number of announcements we consider and the consistency of the results. Where there is insufficient data (ie Observations) available for an announcement, we have not included those announcements in our calculation. |
| The impact of market volatility | The trading volumes have been adjusted to account for overall market volatility. | Overall market volatility can affect trading volumes in all stocks and would impact the integrity of the statistic if not taken into account. |
| How do we interpret our results | We use a 5% p value threshold. We consider derivatives (CFDs and spread bets) and equity separately and test the relevant data independently. For an Announcement Period to be recorded as abnormal, the average trading volume must be higher during the Announcement Period. | Our threshold is set at 5% as it is a standard statistical basis for significance. It is appropriate to consider there to be a relevant difference in trading activity if a difference is detected in either category (equities or derivatives). The trading volume must increase ahead of an announcement to fit the behaviour we are looking for in this metric. |
Testing of Variables
To determine the number of days that form our Benchmark Period and Announcement Period, we ran the tests with varying days. This decision is a trade-off between statistical significance and capturing the relevant trading.
Determining the Length of the Announcement Period
Below are the ATV ratio results based on varying the number of working days for the Announcement Period. The graph shows that 10 days is a reasonable length based on the range of results obtained. There is a trade-off as the longer the periods, the fewer the number of announcements we can consider (as we cannot consider an announcement where its Announcement Period contains more than one potentially price-sensitive announcement). Conversely, the shorter the period, the lower the number of Observations we can use in the test and consequently, the lower the reliability of the test (as a shorter period means a shorter window in which we can observe trading activity).
Chart
Data table
Determining the Length of the Benchmark Period
As we have done for the Announcement Period, below are the results from varying the number of working days for the Benchmark Period. Again, the results move broadly in-line, so we selected 20 working days which gives a good length of time without unnecessarily reducing the number of announcements we can test. Increasing the length of the Benchmark Period up to 26 days, for example, reduces the number of announcements that can be tested by around 20%.
Chart
Data table