
Climate-related risks are increasingly relevant to financial services, affecting consumer outcomes and the effective functioning of markets. We examine how flood risk relates to the mortgage market in England and how it may impact different communities.
1. Introduction
As part of our work on climate adaption and resilience, we analysed the geographical exposure of regulated mortgage lending to flood risk. This helps us identify where flooding from rivers, the sea, and surface water could pose the greatest risk, and where we should focus our resources.
We completed analysis for England using flood risk data from the Environment Agency. We also completed analysis for the risks across Scotland and Wales; however, the differences in geography and population density meant that we could not apply the methodology consistently across all countries. Northern Ireland does not have similar flood risk data available.
Since 2005, firms have been required to report data on all new sales of regulated mortgage contracts. Since 1 April 2021, reporting has also included internal product transfers and further advances completed on or after that date. This data helps us understand the approximate location of mortgage lending.
We mapped mortgage postcode locations against Environment Agency flood risk datasets covering rivers, the sea and surface water. The analysis uses postcode-level flood risk classifications rather than individual property data. It should therefore be viewed as an indicator of overall exposure, not property-specific risk.
Flood risk is classified into bands that reflect the likelihood of flooding. For rivers and the sea, the bands are very low, low, medium and high (see note 1). For surface water, the bands are low, medium and high. A postcode is assigned to a risk band when its centroid, the approximate centre of the postcode, falls within a flood risk area.
2. Overview
Our analysis suggests that 15.5% of mortgage contracts in England are linked to postcodes with some level of flood risk. Exposure varies by region and type of flooding.
These findings help identify where physical climate risks may be most relevant to mortgage lending and where consumers could be more exposed to the impacts of flooding over time.
Map 1: Postcode centroids by risk of flooding from surface water
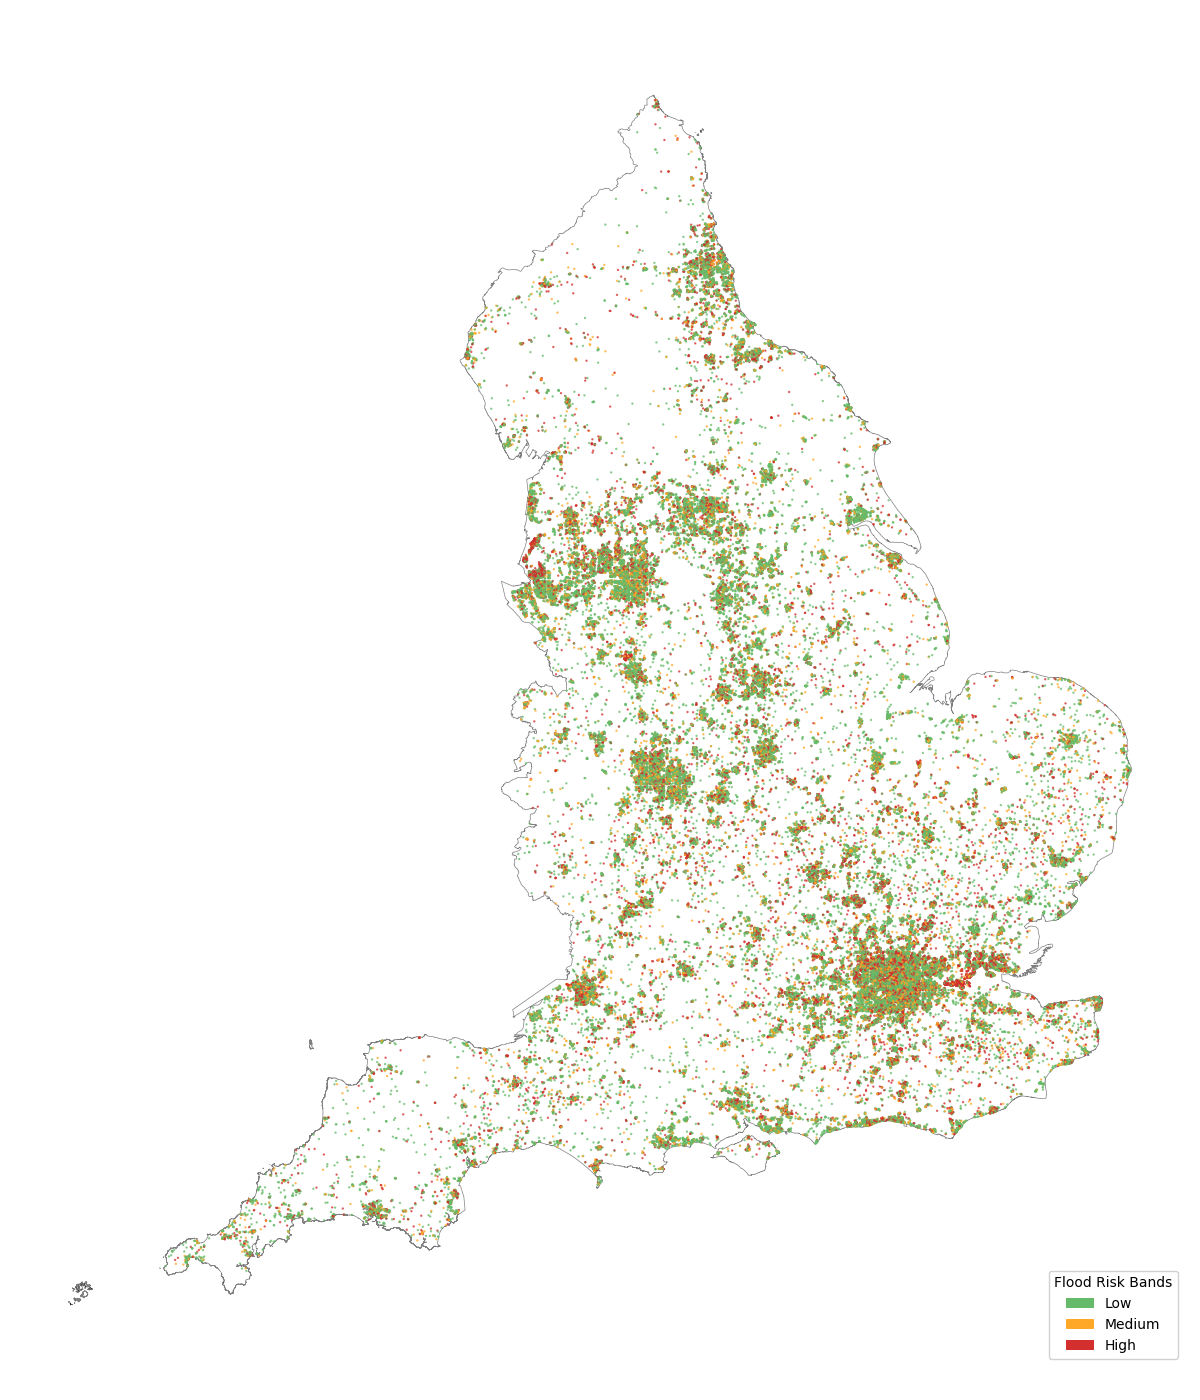
Map of England showing surface water flood risk classifications for postcode centroids. Low, medium and high flood risk locations are distributed across the country, with the greatest concentrations occurring in more densely populated urban areas, particularly London, the Midlands, North West England and parts of Yorkshire. High-risk postcode centroids are present throughout England but represent a smaller proportion of mapped locations than low-risk centroids.
Map 2: Postcode centroids by risk of flooding from rivers and the sea
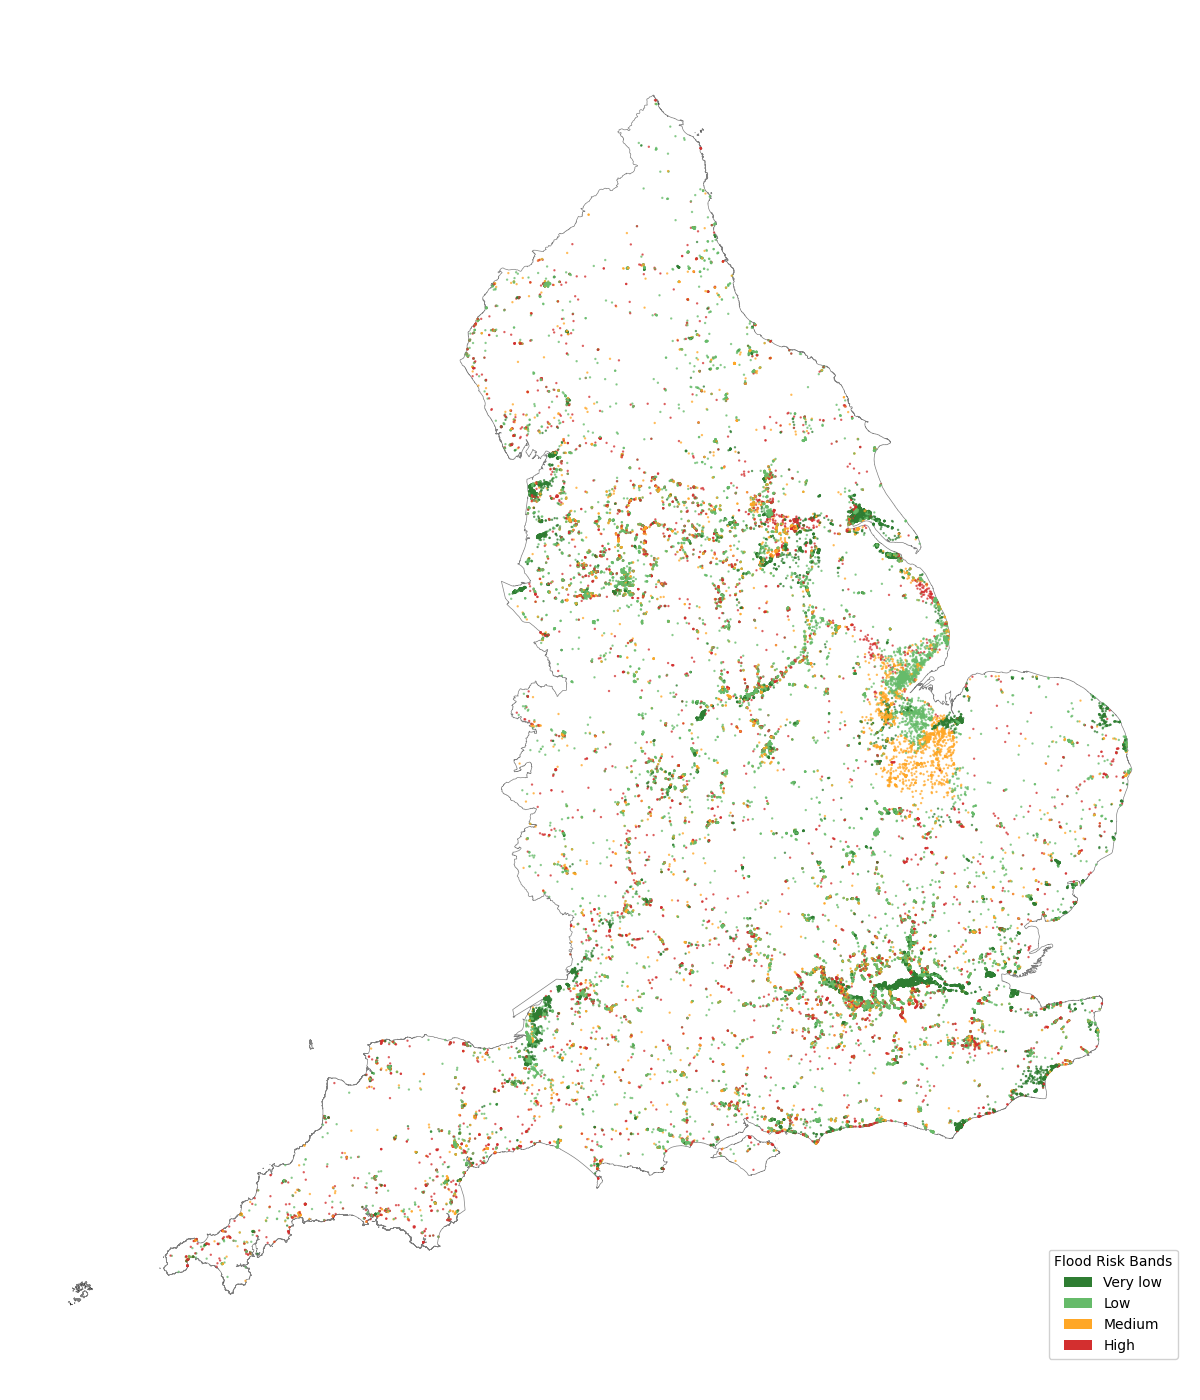
Map of England showing river and sea flood risk classifications for postcode centroids. Very low, low, medium and high flood risk locations are concentrated around major river systems and coastal areas, including the Thames corridor, the Humber estuary and parts of the east and south coasts. High-risk postcode centroids are present across England but are less common than very low and low-risk centroids.
3. Regional flood exposure
Regional flood risk exposure due to surface water flooding.
| Sub Regions | No Risk | Low | Medium | High | Percentage Affected |
|---|---|---|---|---|---|
| Inner London - West | 75.6 | 14.2 | 5.3 | 5 | 24 |
| Inner London - East | 78.7 | 12.2 | 4.4 | 4.8 | 21 |
| Essex | 82.5 | 8.6 | 2.4 | 6.5 | 18 |
| Outer London - West and North West | 80.9 | 10.5 | 3.6 | 5 | 19 |
| Outer London - East and North East | 82.4 | 10.1 | 3.5 | 3.9 | 18 |
| Merseyside | 85.7 | 7.5 | 2.5 | 4.4 | 14 |
| Cambridgeshire and Peterborough | 84.9 | 8.5 | 3.1 | 3.5 | 15 |
| Outer London - South | 84.9 | 8.7 | 3.4 | 3 | 15 |
| West of England | 86.2 | 7.5 | 2.8 | 3.4 | 14 |
| Suffolk | 87.6 | 7 | 2.1 | 3.3 | 12 |
| Bedfordshire and Hertfordshire | 87.6 | 7.1 | 2.1 | 3.2 | 12 |
| Tees Valley | 89.1 | 6.4 | 2.1 | 2.4 | 11 |
| Surrey, East and West Sussex | 90.6 | 5.4 | 1.8 | 2.2 | 9 |
| Greater Manchester | 89.3 | 6.7 | 2.1 | 1.8 | 11 |
| Berkshire, Buckinghamshire and Oxfordshire | 90.9 | 5.2 | 1.7 | 2.2 | 9 |
| Gloucestershire and Wiltshire | 91.1 | 5.1 | 1.7 | 2 | 9 |
| West Midlands | 90.3 | 5.9 | 1.9 | 1.8 | 10 |
| East Yorkshire and Northern Lincolnshire | 89.3 | 7.1 | 2 | 1.6 | 11 |
| Shropshire and Staffordshire | 91 | 5.5 | 1.8 | 1.7 | 9 |
| Leicestershire, Rutland and Northamptonshire | 91.4 | 5.1 | 1.6 | 1.9 | 9 |
| Northumberland, Durham and Tyne & Wear | 91.3 | 5.3 | 1.6 | 1.9 | 9 |
| Cheshire | 90.4 | 6.2 | 2.1 | 1.3 | 10 |
| Lancashire | 91.8 | 4.8 | 1.6 | 1.8 | 8 |
| Herefordshire, Worcestershire and Warwickshire | 91.4 | 5.2 | 1.6 | 1.8 | 9 |
| Kent | 91.5 | 5.1 | 1.6 | 1.8 | 8 |
| Lincolnshire | 91.2 | 5.5 | 1.7 | 1.6 | 9 |
| Cumbria | 92.4 | 4.5 | 1.3 | 1.7 | 8 |
| North Yorkshire | 90.5 | 6.5 | 1.8 | 1.3 | 10 |
| Derbyshire and Nottinghamshire | 91.2 | 5.8 | 1.6 | 1.4 | 9 |
| Norfolk | 93.1 | 4.2 | 1.5 | 1.2 | 7 |
| North Somerset, Somerset and Dorset | 92.3 | 5 | 1.4 | 1.3 | 8 |
| Hampshire and Isle of Wight | 93.6 | 4 | 1.3 | 1.2 | 6 |
| West Yorkshire | 92.8 | 4.8 | 1.2 | 1.2 | 7 |
| South Yorkshire | 91.8 | 5.9 | 1.2 | 1.1 | 8 |
| Devon | 94.1 | 3.7 | 1.1 | 1.1 | 6 |
| Cornwall and Isles of Scilly | 94.4 | 4 | 0.7 | 0.8 | 6 |
Regional flood risk exposure due to flooding from rivers and the sea.
| Sub Regions | No Risk | Very low | Low | Medium | High | Percentage Affected |
|---|---|---|---|---|---|---|
| Lincolnshire | 71.7 | 2.3 | 17.8 | 7.4 | 0.9 | 28 |
| East Yorkshire and Northern Lincolnshire | 62 | 22.5 | 7.8 | 3.6 | 4.1 | 38 |
| Cambridgeshire and Peterborough | 92.1 | 0.3 | 2.8 | 3.7 | 1 | 8 |
| North Yorkshire | 89.3 | 1.1 | 5.8 | 1.7 | 2.1 | 11 |
| Cumbria | 92.8 | 0.7 | 4.2 | 0.9 | 1.4 | 7 |
| South Yorkshire | 94.4 | 1.6 | 1.8 | 1.2 | 0.9 | 6 |
| Surrey, East and West Sussex | 92.6 | 1.8 | 3.5 | 1.1 | 1.1 | 7 |
| Devon | 95.4 | 0.4 | 2.2 | 0.9 | 1.2 | 5 |
| Outer London - South | 95.7 | 0.1 | 2.2 | 0.9 | 1.1 | 4 |
| Lancashire | 91.5 | 4 | 2.7 | 1.1 | 0.8 | 9 |
| Norfolk | 92.3 | 4.1 | 1.7 | 1.6 | 0.2 | 8 |
| Berkshire, Buckinghamshire and Oxfordshire | 94.7 | 0.6 | 2.9 | 0.8 | 1 | 5 |
| Kent | 93.5 | 2.7 | 2.2 | 0.6 | 1 | 6 |
| Derbyshire and Nottinghamshire | 93.2 | 1.1 | 4.2 | 0.9 | 0.7 | 7 |
| Cornwall and Isles of Scilly | 97.6 | 0.2 | 0.8 | 0.6 | 0.8 | 2 |
| North Somerset, Somerset and Dorset | 86.5 | 7.2 | 5.1 | 0.6 | 0.6 | 13 |
| Hampshire and Isle of Wight | 97.1 | 0.4 | 1.3 | 0.3 | 0.8 | 3 |
| Gloucestershire and Wiltshire | 97.2 | 0.3 | 1.4 | 0.5 | 0.6 | 3 |
| Outer London - East and North East | 91.7 | 4.2 | 3 | 0.7 | 0.4 | 8 |
| Inner London - East | 83.9 | 13.1 | 1.9 | 0.4 | 0.7 | 16 |
| Inner London - West | 89.3 | 8.1 | 1.5 | 0.6 | 0.4 | 11 |
| Cheshire | 96.3 | 0.1 | 2.6 | 0.5 | 0.5 | 4 |
| Outer London - West and North West | 95.4 | 1.5 | 2.1 | 0.5 | 0.5 | 5 |
| West Yorkshire | 97.3 | 0.2 | 1.5 | 0.5 | 0.4 | 3 |
| Greater Manchester | 96.1 | 0.4 | 2.6 | 0.5 | 0.5 | 4 |
| West of England | 95.9 | 1.2 | 2 | 0.5 | 0.4 | 4 |
| Herefordshire, Worcestershire and Warwickshire | 97.7 | 0.1 | 1.3 | 0.5 | 0.4 | 2 |
| Essex | 93.6 | 4.2 | 1.4 | 0.4 | 0.3 | 6 |
| Bedfordshire and Hertfordshire | 97.2 | 0.5 | 1.5 | 0.4 | 0.4 | 3 |
| Suffolk | 97.6 | 0.9 | 0.9 | 0.3 | 0.4 | 2 |
| Leicestershire, Rutland and Northamptonshire | 97.8 | 0.3 | 1.4 | 0.4 | 0.2 | 2 |
| West Midlands | 98.8 | 0.1 | 0.5 | 0.2 | 0.3 | 1 |
| Shropshire and Staffordshire | 97 | 1.5 | 1.1 | 0.2 | 0.2 | 3 |
| Merseyside | 96.7 | 2.1 | 0.8 | 0.1 | 0.2 | 3 |
| Tees Valley | 98.8 | 0.1 | 0.8 | 0.2 | 0.1 | 1 |
| Northumberland, Durham and Tyne & Wear | 99 | 0.1 | 0.7 | 0.1 | 0.2 | 1 |
Flood risk exposure is not evenly distributed across England (see notes 2 and 3). High-risk exposure to surface water flooding is concentrated in and around London, with Essex showing the highest proportion of postcode centroids in the high-risk category (6.5%).
Exposure to flooding from rivers and the sea is highest in Lincolnshire and East Yorkshire, where a large portion of postcodes fall within the medium and high-risk categories.
Understanding these geographical patterns helps identify where climate-related risks may have the greatest effect on consumers and mortgage lending if flooding becomes more frequent or severe.
4. High loan-to-value (LTV) ratios
We analysed mortgage contracts sold in the last reporting period to assess whether lending patterns differ across areas with different levels of flood risk.
In the charts below, each group of bars should be viewed separately. The percentages show the proportion of mortgages within each LTV band that are linked to postcodes in each flood risk category. For example, of mortgage contracts with an LTV ratio of 0-10%, around 6% are linked to postcodes classified as low risk for surface water flooding.
For the risk of flooding from surface water, the proportion of mortgages in high-risk areas falls slightly as the LTV ratios increase. Overall, the proportions remain relatively stable, although there is a notable increase in mortgages with an LTV in excess of 100% in medium-risk areas.
Overall, the results do not show a clear or consistent relationship between higher LTV lending and greater exposure to flood risk.
Chart
Data table
Chart
Data table
5. Index of Multiple Deprivation (IMD)
We also analysed flood risk exposure across different levels of deprivation.
The IMD is the official measure of deprivation in England. It combines information on income, employment, education and skills, health, crime, barriers to housing and services, and the living environment.
The charts below show how flood risk exposure varies across these measures. Looking at the combined proportion of the red and orange bands helps identify where more deprived communities may be exposed to flood risk.
Chart
Data table
Chart
Data table
Exposure to surface water flooding is broadly similar across deprivation levels. Within each flood risk band, a higher proportion of mortgages are linked to postcodes in the most deprived areas than to postcodes with no flood risk.
For flooding from rivers and the sea, exposure is spread across all deprivation levels. As flood risk increases, a larger proportion of mortgages are linked to less deprived areas. This may reflect the attractiveness of some properties located near rivers or along the coast.
These findings suggest that physical climate risks can affect a wide range of consumers and communities. They also show that the relationship between flood risk and deprivation can vary depending on the type of flooding.
6. Conclusions
This analysis provides an overview of the exposure of mortgage lending to flood risk in England. We found that around 1 in 7 mortgage contracts are linked to postcodes with some level of flood risk, although exposure varies by region and type of flooding.
The findings show that physical climate risks are relevant to mortgage markets because they affect consumers, firms, and market functioning. However, the results should not be interpreted as an assessment of individual properties, firms or consumer outcomes.
Instead, the analysis is a high-level view of exposure using publicly available flood risk data and mortgage postcode information. It supports our wider work to improve understanding of how climate-related risks may affect financial services and the challenges of climate adaption and resilience.
Caveats and limitations
This analysis estimates mortgage exposure using postcode centroids rather than individual property locations. This means some properties may be assigned to a different flood risk category than their actual location, particularly in larger rural postcodes or postcodes that cross flood risk boundaries.
This approach also cannot capture variation within a postcode. For example, a property may have a lower flood risk than the postcode centroid if it is on higher ground away from a river or flood-prone area.
Results are also sensitive to the location of flood risk boundaries. Small differences in location can lead to different risk categorisations, even where actual levels of risk are similar. Postcode centroids are likely to provide more accurate representation in smaller, densely populated postcodes than in larger postcodes with more spread-out properties. Flood risks that are concentrated in small areas are likely to also be underrepresented.
Our methodology estimates the probability of flooding at postcode level rather than for individual properties. The results should therefore be viewed as indicators of exposure, not property-level risk assessments.
The analysis is intended to support understanding of aggregated exposure and regional pattern identification, but nothing more granular. This analysis does not introduce new regulatory requirements or supervisory expectations.
Attribute Statements
Contains public sector information licensed under the Open Government Licence v3.0.
© Environment Agency copyright and/or database right 2025. All rights reserved.
Contains OS data © Crown copyright and database right 2026
Contains Ministry of Housing, Communities and Local Government data © Crown copyright and database right 2025