

Financial services are a crucial part of the UK economy and its growth. They contribute significantly to the UK’s GDP and employ around 1.1 million people directly. The UK is one of the major global financial hubs, a centre of choice for global fintech investors and firms.
Financial services are also an engine of growth for the wider UK economy, matching capital with investment opportunities and enabling UK businesses to grow and manage risk.
We set out our outcomes and metrics for this theme below.
| Outcome | Metric description | Source | Baseline value | Year 1 value |
|---|---|---|---|---|
| Increased competitiveness of the UK financial services industry | Maintain the UK’s position as one of the top global (i) Financial and (ii) Fintech centres in the world | Global Financial Centres Index, Z/Yen | 2025 Financial centre rank: 2nd Fintech centre rank: 2nd | 2026 Financial centre rank: 2nd Fintech centre rank: 5th |
| More productive and innovative financial services industry | More firms use our innovation and tailored authorisation services | FCA | 2024/25 Number of applications for innovation services*: 176 Number of firms who applied to use our pre-application services (PASS)**: 88 | 2025/26 Number of applications for innovation services*:332 Number of firms who applied to use our pre-application services (PASS)**: 306 |
| We also want to monitor how our work supports UK financial services exports and businesses' access to capital: | ||||
| Increase in financial services exports | Office for National Statistics (ONS) | 2024 £122,726m*** Baseline has been updated with 2024 values | 2025 £135,066m |
| Increase in access to capital for businesses | Bank of England (BoE) | 2024 Total net raised: £15.7bn Restated in February 2026 £15.5bn^ | 2025 Total net raised: £4.4bn | |
What the latest metric values tell us
Overall progress against outcomes in year 1
Movements in the data are broadly in line with expectations of moderate improvement. Most outcome metrics are above baseline, one remains stable and one has declined. In a challenging economic and increasingly competitive global environment, this indicates early positive progress. However, some metrics reflect wider market and international factors, and time is needed to see sustained change against our strategic ambitions.
What’s changed and why this matters
Increased competitiveness of the UK financial services industry
London remained the world’s second‑ranked global financial centre, narrowing the gap with New York to a minimal difference. London remains one of only 2 full service financial markets, with a broad and deep market serving a wide range of investors. This shows its international position is resilient, despite increasing competition.
Edinburgh rose from 29th to 28th place year-on-year.
International competitiveness reflects the UK’s ability to attract investment, talent and financial services activity.
London fell 3 places to fifth in the fintech financial centre ranking. This reflects stronger performance from Asian financial centres and ranking changes affecting other established centres, including New York. Global fintech competition is increasing, including in areas such as digital finance and cryptoassets. Asian financial centres continue to gain market share. This may pose a risk to our strategic ambition. We will continue to monitor this to sustain and strengthen the UK’s global position.
A more productive and innovative financial services industry
More firms are using our innovation and tailored authorisation services. Volumes for innovation services (Innovation Pathway, Digital Sandbox and Regulatory Sandbox) increased by 156 (89%). Use of pre-application support services (PASS) increased by 222 (258%) following expanded capacity to meet increased demand. This suggests stronger demand from firms seeking to enter or expand in the market. Over time, this should support greater innovation and productivity in the financial services sector.
Contributing to growth in the wider economy
Financial services exports increased 10% in nominal terms and 6% in real terms. This increased the sector’s contribution to gross domestic product (GDP) and UK growth. The UK remained the world's largest net exporter of financial services, underlining its continued importance to the economy.
Access to capital remained positive in 2025. UK businesses raised a net £4.4bn of finance. This indicates continued availability of funding from banks, building societies and capital markets to support investment and economic growth. Although lower than in 2024, this does not indicate reduced access to capital. It reflects a smaller increase following higher growth in the previous year.
Macroeconomic and geopolitical uncertainty may have reduced borrowing demand. Firms appear to be favouring shorter‑term, and more flexible options, such as bank lending, rather than bond issuance. This reflects higher interest rates and elevated bond yields. The continued net increase shows firms still have access to a range of financing options to support investment and growth.
Insights on factors influencing the data
Increased competitiveness of the UK financial services industry
Maintain UK’s position as a global financial and fintech centre
To support UK firms and start‑ups and remain competitive, we continued to expand our innovation services. This included the launch of the AI‑powered Supercharged Sandbox with NVIDIA, alongside existing services such as the Digital Securities Sandbox, Regulatory and Innovation Pathway sandboxes, Smart Data Accelerator, and AI live testing.
These services aim to make it easier for firms to invest, innovate and raise capital, while maintaining appropriate regulatory standards. Our international work, including the Berne Financial Services Agreement and collaboration with the Office for Investment: Financial Services, supports the UK’s openness to trade and investment. Together, these actions help strengthen the UK’s position as a leading global financial and fintech centre.
Competitors in Asia, among the top 5 financial and fintech centres, are making significant strategic investments to strengthen their global positions. Shenzhen, now ranked second in the fintech index, has developed as a major centre within the Shenzhen–Hong Kong–Guangzhou innovation cluster. The scale and integration of these ecosystems position them as strong competitors to established centres such as London and New York.
A more productive and innovative financial services industry
More firms use our innovation and tailored authorisation services
We improved the speed and predictability of authorisations, providing earlier and clearer decisions without lowering standards. We introduced new targets, and more firms were informed we were ‘minded to approve’ their application, giving earlier certainty to enter or expand.
We strengthened support for growing firms by establishing a joint FCA and Prudential Regulation Authority (PRA) scale‑up unit. We increased early and high growth oversight capacity by 50%, and expanded pre‑application support across wholesale, payments and cryptoasset firms. We also extended support to consumer investments, solo-regulated insurance and targeted support sectors.
Improvements in productivity and innovation will take longer to emerge. At this stage, the data reflects increased use of regulatory support rather than clear outcome impact.
Contributing to growth in the wider economy
Increase financial services exports
Financial services exports increased as of April 2026, driven by strong performance in insurance, including marine, aviation and transport, and banking. The UK remains the world’s largest cross-border banking centre, leading in international bank lending and global foreign exchange turnover, with these structural strengths supporting performance.
Our regulatory initiatives helped strengthen the UK’s position as a competitive global financial services hub. This includes expanding our international presence and strengthening strategic partnerships. Initiatives such as the Berne Financial Services Agreement, simplified insurance rules and our presence in the US, Asia‑Pacific and Singapore are improving market access for UK firms and supporting inward investment.
We continue to work closely with industry and government. This includes partnerships such as our work on AI with the Monetary Authority of Singapore and support for the Office for Investment: Financial Services helps position the UK as a leading centre for innovation and global capital flows.
Increase in access to capital
Gross lending to small and medium‑sized enterprises (SMEs) remained strong. Challenger and specialist banks provided around 60% of lending. Demand for debt financing in capital markets remained high, alongside periods of net repayment and ongoing balance sheet and capital management.
We made it easier for companies to raise capital through prospectus reforms and a new public offer platform. This reduced friction in access to funding and broadened investor opportunities. We expanded access to private markets through the Private Intermittent Securities and Capital Exchange System (PISCES). We approved 4 operators and have 2 more in the pipeline, supporting growing companies.
Further changes, including listing rule reforms, improved bond market access and greater derivatives transparency, support faster capital raising and increase investor opportunities.
Historical values
Graph 1
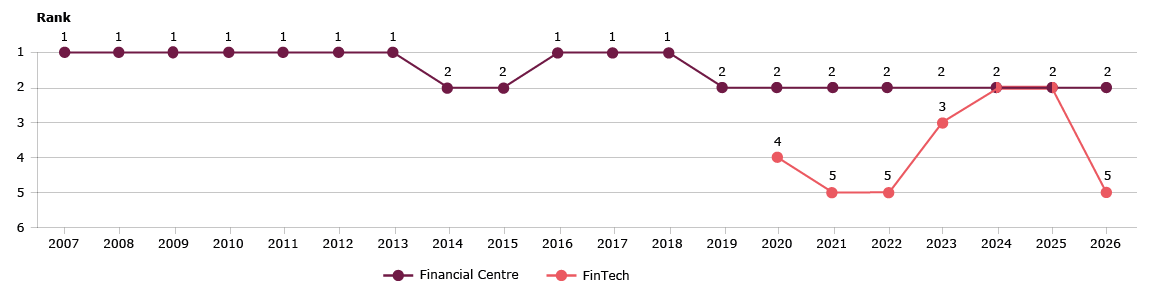
The UK has consistently ranked among the world’s top 2 financial centres since 2007. It has also remained within the top 5 fintech hubs since the index began in 2020. The latest results show a decline in the fintech ranking, from second place in 2025 to fifth in 2026.
UK global financial centre & FinTech ranking
Source Z/Yen
Graph 2a
Chart
Data table
The Innovation Pathway, Digital Sandbox and Regulatory Sandbox received 719 applications between 2023/24 and 2025/26. Demand for Digital Sandbox was high in 2023/24, reflecting interest before launch. Volumes fell in 2024/25 but increased again in 2025/26.
Applications are now higher than in both previous years, indicating sustained demand for our innovation services beyond the initial launch period.
Graph 2b
Chart
Data table
Applications for the Pre‑Application Support Service (PASS) increased to 306 in 2025/26, up from 88 in 2024/25 following an expansion of the service. We extended PASS to cover consumer investments and solo-regulated insurance after April 2025, and targeted support firms from August 2025 to meet increased demand. This shows a significant increase in demand and greater use of tailored pre‑application support by firms engaging with the FCA.
Graph 3
Chart
Data table
CP= Nominal. not adjusted for inflation
Financial services exports have approximately doubled in nominal terms between 2007 and 2023, with average annual growth of around 5%. Data for 2025/26 shows a higher rate of growth than in recent years.
Graph 4
Chart
Data table
Data Source: Bank of England/Capital raised by Private Non-Financial Corporations (PNFCs)
Note the Bank's data reflects sources of financing raised by firms in the UK. It does not give the full size of capital markets or the level of liquidity in markets. Since our capital markets are global, this may also not reflect the total UK picture of financial services activity in providing capital.
Historic net financing trends peaked in 2020, followed by a sharp decline from 2020 to 2023, it then increased from 2023. The latest data shows a net positive of £4.4bn. This indicates continued access to capital, reflecting a recovery in the volume of finance raised through banks, capital markets and other sources. Although the net figure is lower than in 2024, it remains positive and does not suggest reduced access to capital. Capital raised exceeded repayments in 2025, continuing the increase seen in the previous year.