
This is an overview of geographical cash access coverage in the UK at the end of the second half-year (July to December) of 2025. This monitoring forms part of the FCA’s work on access to cash.
While previous access to cash coverage publications reported on quarterly changes in data, this publication and future publications will report on 6-monthly changes in the UK’s cash access coverage. We will publish the outstanding data from H2 2024 and H1 2025 in due course.
1. Introduction
As part of our work on access to cash, we regularly publish data on changes in the UK’s cash access coverage. This includes the locations of cash access points and other information such as temporary closures, opening hours and accessibility. These publications are based on quarterly data from designated banks and building societies on their brick-and-mortar and mobile branch networks, and monthly data covering automated teller machines (ATMs) and the Post Office network. We supplement this information with annual data on both cashback locations and branches of large non-designated personal current account (PCA) providers (see note 1).
This analysis shows the proportion of the population that lives within a range of distances of various types of cash access point. We measure distances as the crow flies (see note 2), consistent with the approaches adopted by LINK and the Post Office, relative to residential addresses (see note 3).
We estimate that for access to cash via designated banks and building societies providing PCA and Post Office: all branches, including mobile bank branches:
- 97.2% of the UK urban population are currently within 1 mile of a free-to-use cash access point offering deposits.
- 97.3% of the UK rural population are currently within 3 miles of a free-to-use cash access point offering deposits.
We estimate that for access to cash via any bank, building society, Post Office branch or any free ATM:
- 99.6% of the UK urban population are currently within 1 mile of a free-to-use cash access point offering withdrawals.
- 98.1% of the UK rural population are currently within 3 miles of a free-to-use cash access point offering withdrawals.
The headline coverage figures remain broadly comparable with previous data publications. They continue to show more than 95% of the UK population being within the distances set out in the Treasury’s Cash Access Policy Statement.
2. Coverage
The data comprises 57,658 reported UK cash access points and 548,885 cashback locations. Table 1 shows numbers by region for 8 types of access point (see notes 4, 5, and 6):
- Brick-and-mortar branches of banks and building societies are subdivided into 2 groups. The first group is the branches of the 14 banks and building societies designated under Part 8B of the Financial Services and Markets Act 2000 for the provision of cash access services (Type A) who we collect quarterly coverage data from. The second group is the branches of some larger non-designated PCA providers (Type B) who we collect annual data from.
- Mobile bank branches (measured by stops) are a separate type (D).
- Post Office branches are subdivided into mobile / outreach branches (type E) and all other Post Office branches (type C). The outreach branches are brick-and-mortar but are more similar to mobile branches, being typically open for a small number of hours or on selected days of the week. For example, these include limited time to serve access points in community buildings in rural locations. For this reason, we group the mobile and outreach branches together.
- ATMs are subdivided into free-to-use (type F) and pay-to-use (type G).
- Cashback locations (type H) are all the unique locations where a cashback transaction took place in the most recent year of data for relevant cashback provider.
Table 1: Number of cash access points by type and geographical area
| Country/ geographical area | England | Northern Ireland | Scotland | Wales | UK Total | |||||||||
|---|---|---|---|---|---|---|---|---|---|---|---|---|---|---|
| Type | Description | East Midlands | East of England | London | North East | North West | South East | South West | West Midlands | Yorkshire and The Humber | ||||
| A | Larger banks and building societies providing PCA (brick-and-mortar branches) | 178 | 263 | 346 | 112 | 271 | 423 | 258 | 259 | 201 | 110 | 335 | 179 | 2935 |
| B | All other banks and building societies (brick-and-mortar branches) | 3 | 11 | 37 | 2 | 30 | 19 | 3 | 7 | 2 | 5 | 2 | 121 | |
| C | Post Office branches (including banking hubs, excluding mobile/ outreach) | 691 | 924 | 677 | 386 | 908 | 1178 | 937 | 751 | 783 | 455 | 1006 | 651 | 9347 |
| D | Mobile bank branches | 12 | 12 | 21 | 42 | 53 | 5 | 5 | 13 | 371 | 79 | 613 | ||
| E | Mobile/ outreach Post Office branches | 110 | 181 | 82 | 120 | 117 | 246 | 84 | 129 | 22 | 214 | 209 | 1514 | |
| F | Free-to-use ATMs | 2439 | 2780 | 4375 | 1502 | 3823 | 4131 | 2502 | 3018 | 2970 | 1387 | 3425 | 1650 | 34002 |
| G | Pay-to-use ATMs | 552 | 730 | 1262 | 479 | 1321 | 900 | 581 | 967 | 709 | 236 | 902 | 487 | 9126 |
| H | Cashback locations | 37585 | 48480 | 85885 | 18981 | 60178 | 73793 | 48976 | 44766 | 43648 | 15806 | 45514 | 25273 | 548885 |
| All sources excluding cashback | 3985 | 4901 | 6697 | 2563 | 6494 | 6810 | 4580 | 5091 | 4799 | 2223 | 6258 | 3257 | 57658 | |
| All sources including cashback | 41570 | 53381 | 92582 | 21544 | 66672 | 80603 | 53556 | 49857 | 48447 | 18029 | 51772 | 28530 | 606543 | |
We have analysed coverage for 14 groups of cash access points which we define in Table 2. The groups are constructed by combining the cash access point types and cashback locations:
- Group 1 includes type A (designated banks and building societies) access points only.
- Group 2 adds the non-mobile/outreach Post Office network, including banking hubs.
- Group 3 includes brick-and-mortar (except type B) and mobile/outreach designated bank, designated building society and all Post Office branches including banking hubs.
- Groups 4 and 5 include the same cash access point types as Group 3, as well as all free-to-use ATMs and all ATMs respectively.
- Group 6 includes type B branches and contains all free-to-use access points.
- Group 7 includes all 57,658 recorded cash access points.
- Groups 8 and 9 focus on access to ATMs, for free-to-use and all ATMs, respectively.
- Groups 10, 11, and 12 combine free-to-use access points, all access points and all ATMs respectively with cashback locations.
- Groups 13 and 14 focus on access to the Post Office network, distinguishing between non-mobile/outreach branches and all branches.
Due to substitutability, as outlined above, type B branches are only included in groups 6, 7, 10, and 11.
Table 2: Groupings of cash access points
| Group | Description | Cash access point types included | Number of entries | |||||||
|---|---|---|---|---|---|---|---|---|---|---|
| A | B | C | D | E | F | G | H | |||
| 1 | Designated Banks and Building Societies: brick-and-mortar branches | x | 2935 | |||||||
| 2 | Designated Banks and Building Societies and Post Office: brick-and-mortar branches (including banking hubs) | x | x | 12282 | ||||||
| 3 | Designated banks and building societies and Post Office: all branches (including mobile and banking hubs) | x | x | x | x | 14409 | ||||
| 4 | Designated banks and building societies and Post Office: all branches (including mobile and banking hubs), and free-to-use ATMs | x | x | x | x | x | 48411 | |||
| 5 | Designated banks and building societies and Post Office: all branches (including mobile and banking hubs), and all ATMs | x | x | x | x | x | x | 57537 | ||
| 6 | All free-to-use cash access points (excluding cashback) | x | x | x | x | x | x | 48532 | ||
| 7 | All cash access points (excluding cashback) | x | x | x | x | x | x | x | 57658 | |
| 8 | Free-to-use ATMs | x | 34002 | |||||||
| 9 | All ATMs | x | x | 43128 | ||||||
| 10 | All free-to-use cash access points and cashback locations | x | x | x | x | x | x | x | 597417 | |
| 11 | All cash access points and cashback locations | x | x | x | x | x | x | x | x | 606543 |
| 12 | All ATMs and cashback locations | x | x | x | 592013 | |||||
| 13 | Post Office branches excluding outreach and mobile | x | 9347 | |||||||
| 14 | All Post Office branches | x | x | 10861 | ||||||
On this web page we provide highlights of coverage in Table 3. We present data for groups 3 and 6 as proxies for free cash withdrawal access and cash deposit access for consumers. We provide these figures for Great Britain, Northern Ireland and the UK as a whole split by overall, rural and urban at distances of 1 mile and 3 miles.
Table 3: Percentages of the UK population that have access to a source of cash within a given distance as of 2025 H2 (groups 3 and 6)
Group 3: Larger banks and building societies providing PCA and Post Office: all branches, including mobile and banking hubs
| Region | Rural / Urban | Population, 000's | 2km | 5km | 1mi | 3mi |
|---|---|---|---|---|---|---|
| UK | Overall | 67070.1 | 94.1 | 99.6 | 91.5 | 99.5 |
| UK | Rural | 12742.2 | 73.5 | 97.7 | 67.1 | 97.3 |
| UK | Urban | 54327.9 | 99 | 100 | 97.2 | 100 |
| GB | Overall | 65174.6 | 94.5 | 99.6 | 91.8 | 99.5 |
| GB | Rural | 12033 | 74.4 | 97.8 | 68.1 | 97.4 |
| GB | Urban | 53141.6 | 99 | 100 | 97.2 | 100 |
| NI | Overall | 1895.5 | 83.2 | 98.3 | 79.2 | 98.1 |
| NI | Rural | 709.3 | 57.2 | 95.6 | 50.3 | 94.8 |
| NI | Urban | 1186.2 | 98.7 | 100 | 96.5 | 100 |
Group 6: All free-to-use cash access points (excluding cashback)
| Region | Rural / Urban | Population, 000's | 2km | 5km | 1mi | 3mi |
|---|---|---|---|---|---|---|
| UK | Overall | 67070.1 | 95.9 | 99.7 | 94.6 | 99.6 |
| UK | Rural | 12742.2 | 78.9 | 98.4 | 73.4 | 98.1 |
| UK | Urban | 54327.9 | 99.8 | 100 | 99.6 | 100 |
| GB | Overall | 65174.6 | 96.1 | 99.7 | 94.9 | 99.7 |
| GB | Rural | 12033 | 79.8 | 98.4 | 74.4 | 98.2 |
| GB | Urban | 53141.6 | 99.8 | 100 | 99.6 | 100 |
| NI | Overall | 1895.5 | 86.1 | 99 | 83.1 | 98.8 |
| NI | Rural | 709.3 | 63.5 | 97.4 | 56.1 | 96.9 |
| NI | Urban | 1186.2 | 99.7 | 100 | 99.2 | 100 |
Estimated percentages of the UK population living within a given distance from a cash access point for all groups 1-14 can be downloaded via the link below (see notes 7, 8, and 9).
We give the estimates for the UK regions and devolved nations separately, as well as for England and the UK overall. We also give estimates for rural and urban areas (see note 10).
The distances considered are 1, 2, 3, 5, and 10 miles (approximately 1.6, 3.2, 4.8, 8.0 and 16 km, respectively).
Download Table 3 data (xlsx)
Figure 1 shows the coverage areas underlying the population estimates in Table 3. As in Table 3, the cash access points are those in groups 1-14. In each case the areas shown are those without access to a source of cash within 1, 2, 3, 5 and 10 miles. The interactive tooltips show percentages of the Local Authority District population with access to a source of cash within the above range of distances.
Download underlying data for Figure 1 maps (XLSX)
Figure 1: Access to cash coverage in the UK in 2025 H2

3. Other insights
3.1. Temporary closures
We cannot give precise figures for temporary closures because a high proportion of branches did not provide this information. Of type A branches that provided this information (91%), 8.3% were temporarily closed for at least 1 day.
We do not have equivalent information for Post Office branches.
3.2. Opening hours
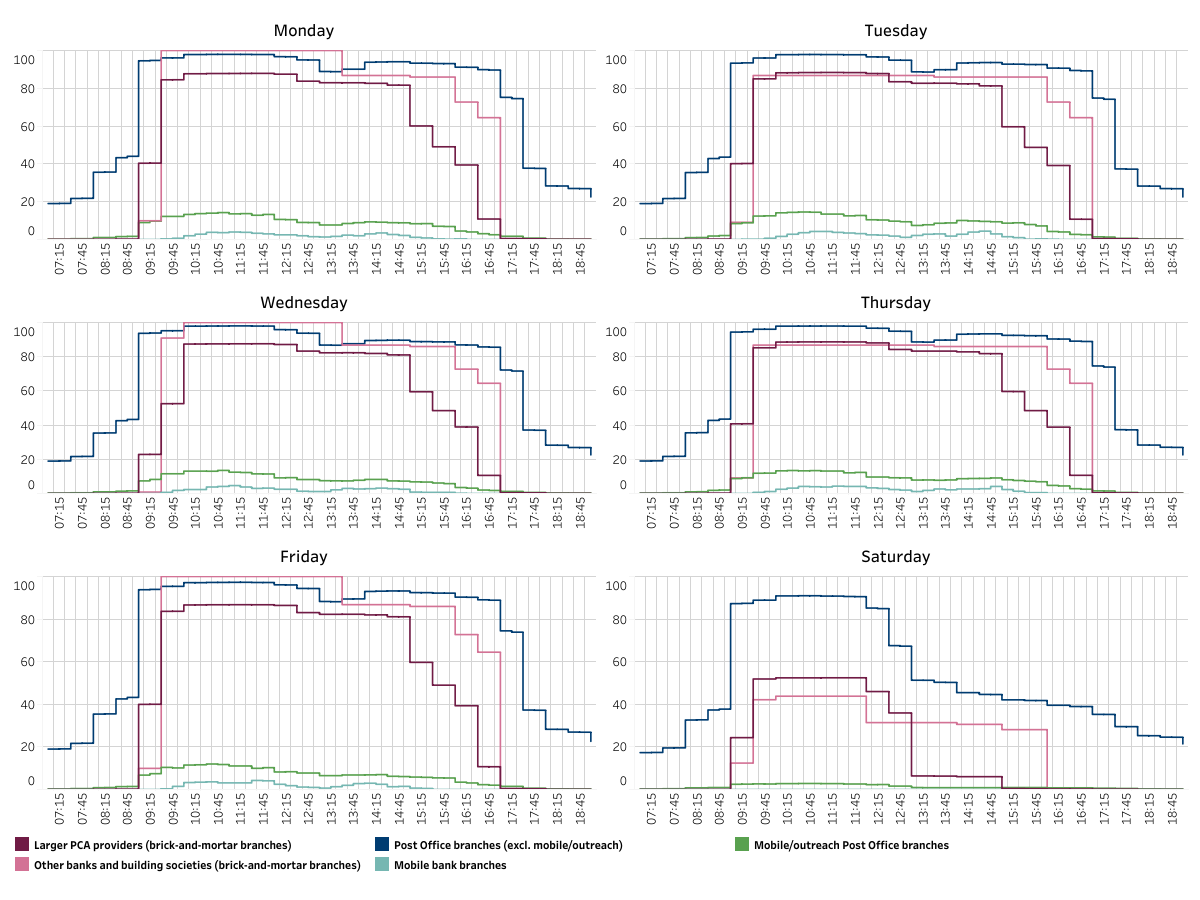
While external and stand-alone ATMs are always accessible, in-branch cash withdrawals and deposits and other banking services are only available during branch opening hours.
Figure 2 shows the percentages of branches open at a given time between 7am and 7pm, Monday to Saturday (see note 11), by branch types defined in Table 1.
Figure 2 Percentages of branches open at a given time by branch type
3.3. Accessibility
For some consumers, being able to use branch services depends on accessibility.
Table 4 shows percentages of branches that are wheelchair accessible, have step-free access and/or have a hearing/induction loop available for the 3 types of bank and building society branches (see note 11). The step-free access characteristic does not apply to mobile branches (see note 12).
Of the brick-and-mortar bank and building society branches, 91.6% of type A (designated banks and building societies) and 78.5% of type B (large non-designated PCA provider) branches have all 3 features. Excluding the branches for which some values are unreported, these percentages become 97.7% and 78.5% respectively.
In this publication, we do not have equivalent information for Post Offices.
Table 4: Percentages of branches with common accessibility characteristics by branch type
| Wheelchair accessible | Has step-free access | Has hearing/ induction loop available | ||||||||
|---|---|---|---|---|---|---|---|---|---|---|
| Access point type | Sample | Yes | No | Unreported | Yes | No | Unreported | Yes | No | Unreported |
| A: Larger banks and building societies providing PCA (brick-and-mortar branches) | All data | 92.4 | 1.3 | 6.2 | 92.2 | 1.5 | 6.2 | 93.4 | 0.4 | 6.2 |
| Excluding unreported | 98.6 | 1.4 | x | 98.4 | 1.6 | x | 99.5 | 0.5 | x | |
| B: All other banks and building societies (brick-and-mortar branches) | All data | 86.8 | 13.2 | - | 86.0 | 14.0 | - | 100.0 | - | - |
| Excluding unreported | 86.8 | 13.2 | x | 86.0 | 14.0 | x | 100.0 | x | x | |
| D: Mobile bank branches | All data | 79.0 | 21.0 | - | - | 100.0 | - | 100.0 | - | - |
| Excluding unreported | 79.0 | 21.0 | x | - | 100.0 | x | 100.0 | - | x | |
4. Attributions
As well as the data from banks, building societies, and the Post Office, the analysis uses other open data and data licensed under the Public Sector Geospatial Agreement:
- Contains OS data © Crown copyright and database right 2025.
- Contains NRS data © Crown copyright and database right 2022.
- Contains NISRA data © Crown copyright and database right 2021.
- Contains National Statistics data © Crown copyright and database rights 2021/2022/2023/2024/2025.
- Contains Royal Mail data © Royal Mail copyright and database right 2025.
- Office for National Statistics licensed under the Open Government Licence v.3.0.
- Contains public sector information licensed under the Open Government Licence v3.0.
- This product contains data created and maintained by Scottish Local Government.