We publish details of the complaints received by banks, insurers, lenders and other firms, and what those complaints were about. See the latest data and the most complained about firms and financial products.
Financial firms provide us with data every six months about the complaints they have received, what these were about and how they have dealt with them. The firms also have to publish this information themselves.
Making a complaint to a financial services firm is a free and straightforward process that you can do yourself. Find out more about how to complain.
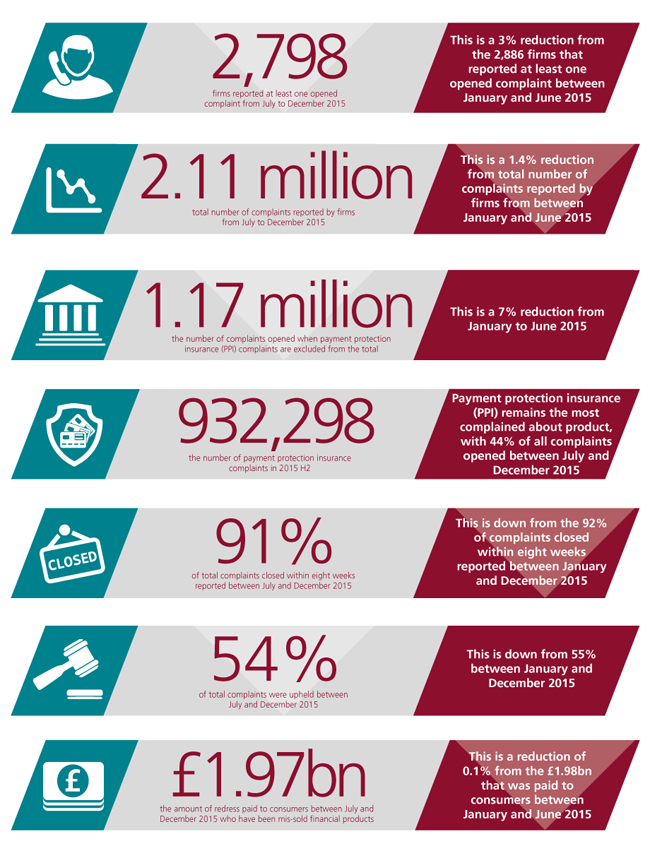
Complaints from July to December 2015
Consumers made a total of 2.11 million complaints to firms in the second half of 2015. This is 1.4% less than the number made in the previous six months, mainly driven by a 10% drop in complaints about current accounts and a 15% drop in complaints about savings accounts.
When payment protection insurance (PPI) is excluded, the number of complaints between July and December 2015 is reduced to 1.17 million. PPI remains the most complained about product, rising by 6% in the period. Although current accounts saw one of the largest reductions in complaints numbers, they are still the second most complained about financial product in the period covered.
The total redress paid to consumers fell to £1.97 billion between July and December 2015, which is slightly lower than the £1.98 billion paid between January and June 2015. The fall in redress payments was mainly due to a 2% fall in payments related to general insurance and pure protection products, which accounted for almost 82% of complaints redress payments.
Other product categories saw a reduction in redress payments between July and December 2015, except for banking and credit cards which increased by almost 27% and home finance which increased by 17%.
Most complained about firms
We use the data that firms provide us to show you how many complaints each one has received, where it was 500 complaints or more in the reporting period. We also show details of how many complaints were closed, how many of these were upheld and how quickly they were dealt with.
You can find out how many complaints a firm received or see the table below for the firms that received the most complaints in the first half of 2015.
| Firm name | No. of complaints | % change* |
|---|---|---|
| Barclays Bank Plc | 279,561 | -1% |
| Lloyds Bank Plc | 230,041 | -1% |
| Bank of Scotland Plc | 182,702 | -4% |
| National Westminster Bank Plc | 135,262 | -7% |
| HSBC Bank Plc | 120,986 | -14% |
*Change between January to June 2015 and July to December 2015.
Most complained about products
We also publish data that shows the total number of complaints about different product groups, types of firms and the reason for the complaint.
You can see the number of complaints according to product type and the reason behind the complaints. The table below shows the most complained about financial products.
| Financial product | No. of complaints opened | % change* |
|---|---|---|
| Payment protection insurance | 932,298 | +6% |
| Current accounts | 454,276 | -10% |
| Other general insurance | 296,505 | -3% |
| Credit cards | 132,988 | +9% |
| Savings (inc Cash ISAs) and other banking | 67,546 | -15% |
*Change between January to June 2015 and July to December 2015.
More on the complaints data
Firms do not have to report complaints to the FCA that have been resolved by close of business on the business day following their receipt. These complaints are not included in this data.
Find out more about the complaints data that firms provide to us.
Although we do not currently publish the number of complaints by number of customers or number of accounts – to put their figures into context in relation to the size of their business - we recommend that firms do so on their own websites. Our downloadable table provides a link to each firm’s website where you can find this additional information.