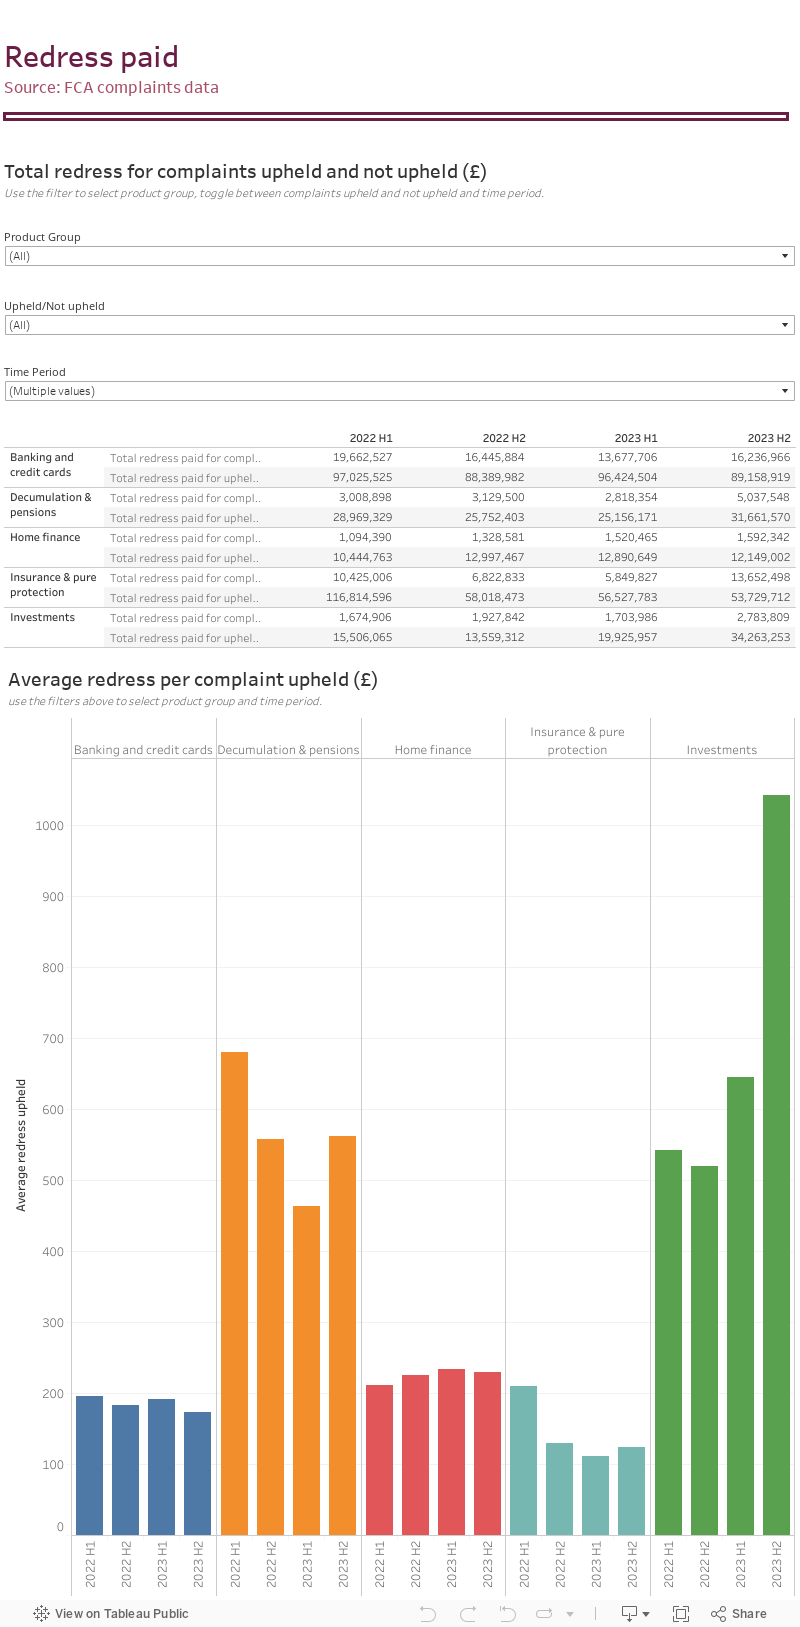
This page shows a breakdown of redress paid for complaints upheld and not upheld by product group. We show the average redress per complaint not upheld by product group.
15 May 2026 update
Following our investigation into a reporting anomaly in one firm’s complaints return, we have updated the H1 2025 and H2 2025 data.
Complaints about motor insurance, and insurance and pure protection are lower as a result, and other figures have been revised to reflect minor updates from firms.
Download the underlying data and notes for this Tableau dashboard (XLSX)[1]
Redress paid