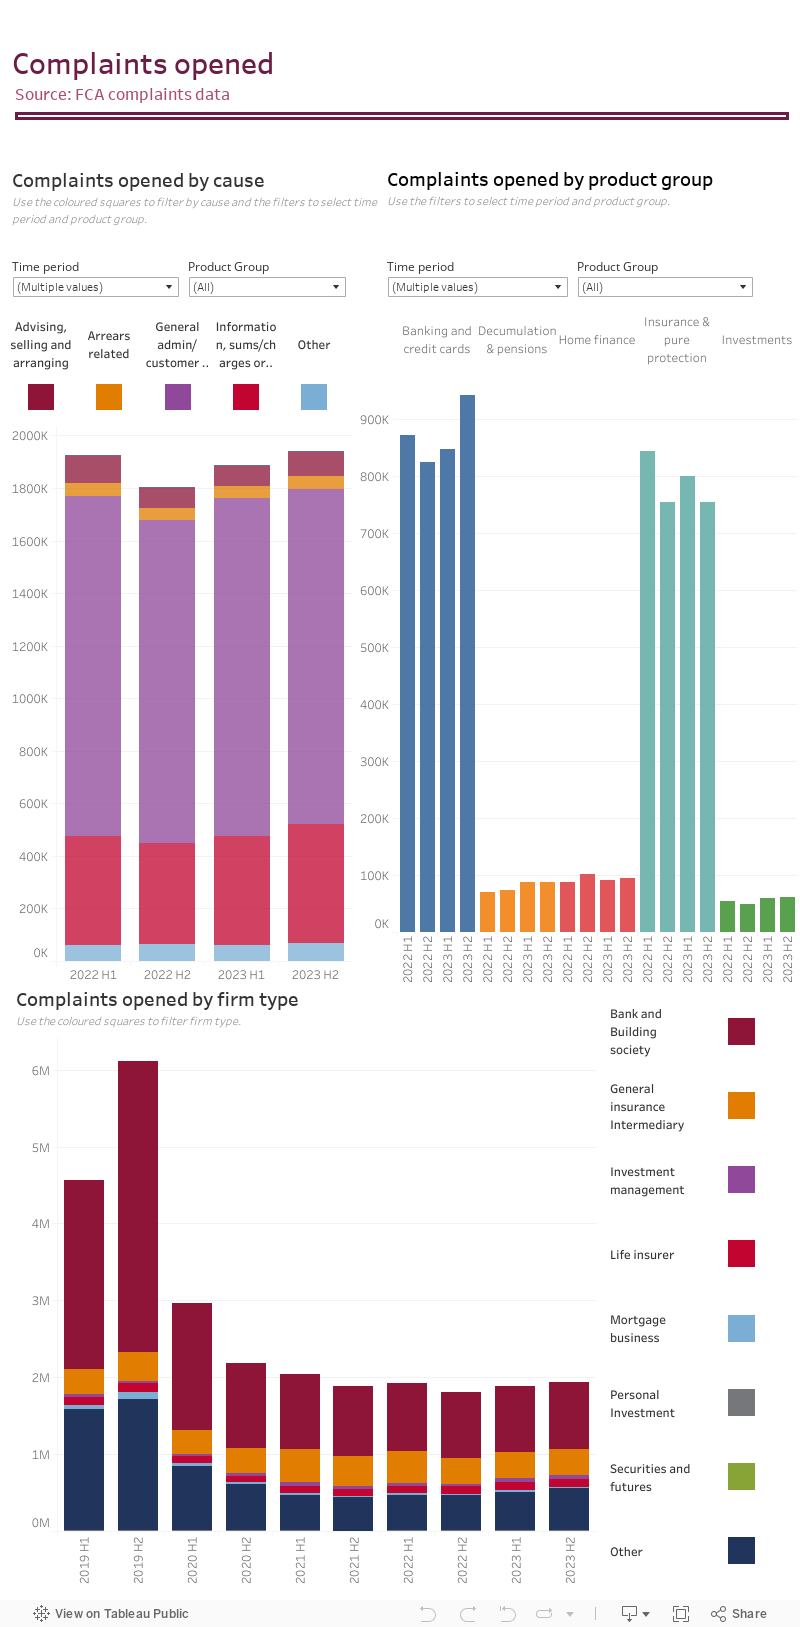
This page shows a breakdown of complaints opened, by product, product group and firm type. For the 5 product groups, we break down volume of complaints opened by cause of complaint.
15 May 2026 update
Following our investigation into a reporting anomaly in one firm’s complaints return, we have updated the H1 2025 and H2 2025 data.
Complaints about motor insurance, and insurance and pure protection are lower as a result, and other figures have been revised to reflect minor updates from firms.
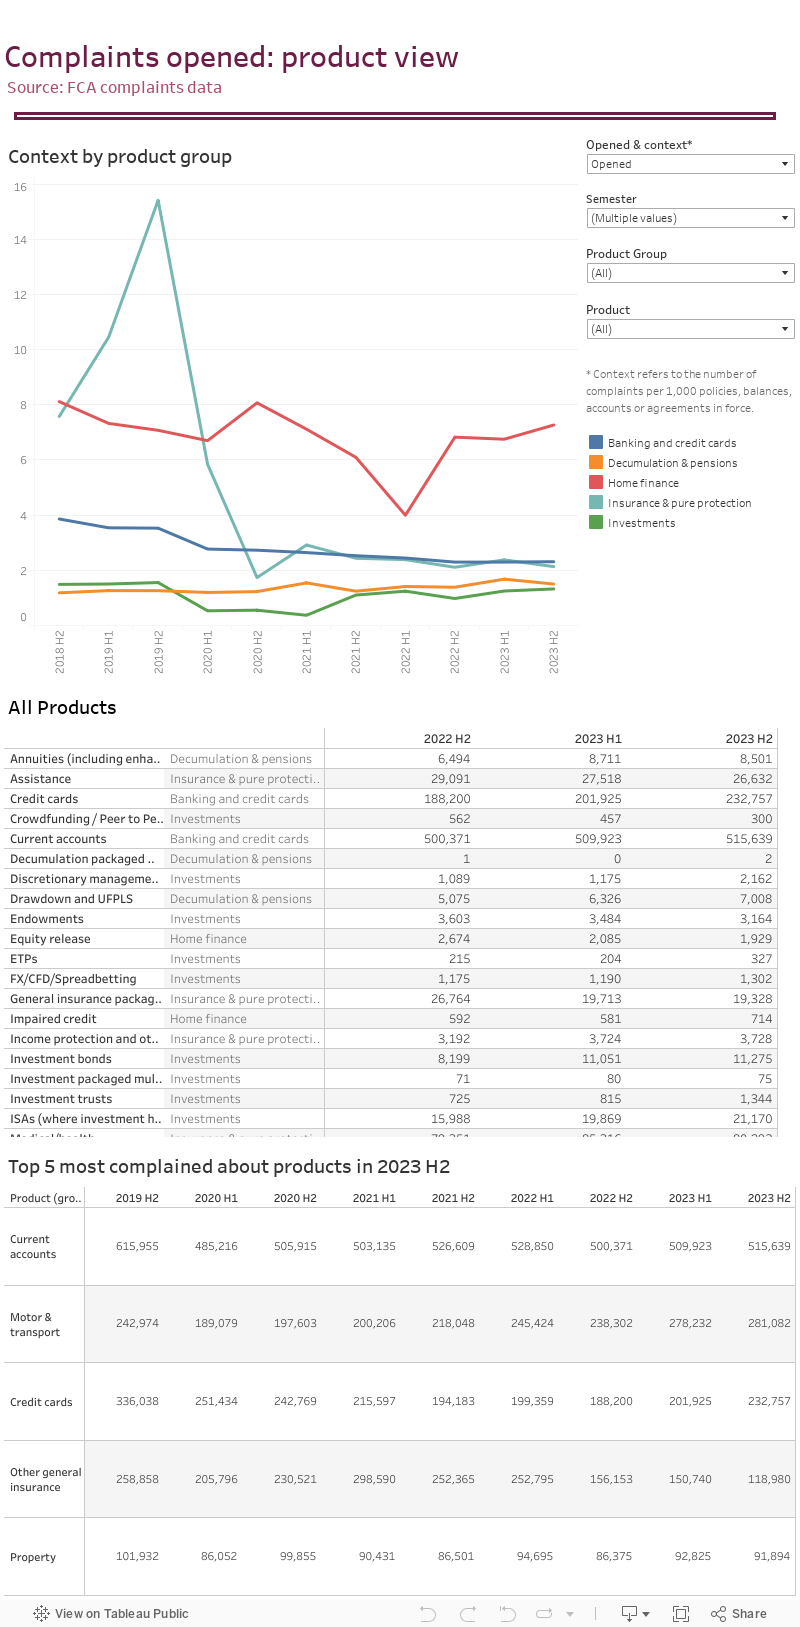
We also show contextual figures, referring to the volume of complaints opened per 1,000 policies, balances, accounts or agreements in force.
Download the underlying data and notes for the Tableau dashboards (XLSX)[1]
Opened
Opened complaints: product view